The state of health care and adult social care in England 2025/26
Downloads
Urgent and emergency care
Changing picture for NHS 111
NHS 111 is a non-emergency 24/7 service enabling people to receive urgent advice, care and treatment in situations that are less urgent than the need to call 999. Initially launched as a telephone service in 2011, NHS 111 online was rolled out in 2017.The service is constantly evolving and a new dedicated service for people experiencing a mental health crisis was introduced in April 2024 (see section on access to mental health in the community).
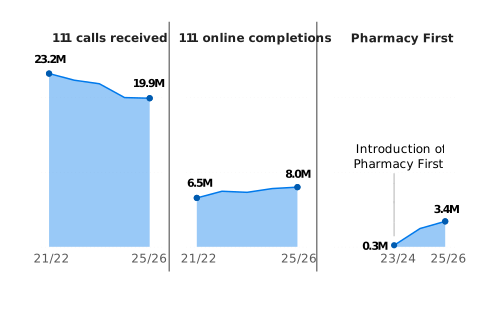
In last year’s report, we reported that the number of calls to NHS 111 had dropped dramatically. In 2025/26, use of the NHS 111 call service has continued to decrease but at a slower rate, dropping by 85,000 calls to less than 19.9 million. This ongoing decrease could be linked partly to the increase in use of NHS 111 online, the rollout of online booking for GP appointments in 2025, and the introduction of the national NHS Pharmacy First service in January 2024.
While the number of calls to NHS 111 has been falling year-on-year since 2021/22, more people are now seeking help through the NHS 111 online service, with almost a third (29%) of people seeking advice from the online service as opposed to calling in 2025/26.
Similarly, since its launch, the number of consultations provided by the NHS Pharmacy First service has continued to increase, with over 3.4 million consultations in 2025/26. In addition, a recent Healthwatch poll of 7,029 adults showed that of the 3,104 people who responded, almost 9 in 10 (86%) reported a positive experience of visiting their pharmacy to get support with one of the 7 common conditions covered by the scheme.
Figure 22: Changing picture for NHS 111
Number of NHS 111 calls received, online completions, and Pharmacy First consultations 2021/22 to 2025/26
Source: NHSE 111 calls and online completions, NHSBSA Pharmacy First, 2021/22 to 2025/26
For people calling the NHS 111 service, we continue to see an improvement in how quickly they are able to get help. In 2025/26, people waited on average 54 seconds for their call to be answered, 6 seconds faster than in 2024/25 where the national average speed to answer calls was 1 minute. However, this is still above the standard for the average time to answer calls of 20 seconds or less.
Once people are assessed, either over the phone or online, if their symptoms meet the criteria, they will be offered a callback from a clinician and given a timeframe in which this will happen. The standard is that 90% of people who require a clinical callback should receive this within the agreed timeframe.
The number of NHS 111 callers or online contacts that needed a callback increased by 146,000 (3.3%) to over 4.6 million in the 2025/26. Only 41% of those who needed a clinical callback received it within the agreed timeframe, compared with 43% in 2024/25. Over the last year, no region or care provider met the 90% standard.
Ambulance services still under pressure
As we have reported in previous State of Care reports, the pressure on ambulance services continues to grow, with nearly 14 million 999 ambulance calls in 2025/26, which is 435,000 (3.3%) more than in 2024/25. Alongside this growth in demand, the average time taken to answer a 999 call for an ambulance has continued to improve, with an average time of 4 seconds in 2025/26, down from 5 seconds in 2024/25.
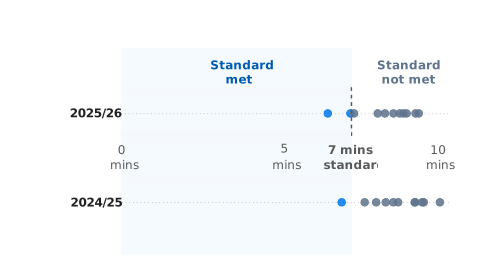
Similarly to last year, although the performance of ambulance services against response times has improved, they are still not meeting the required standards. For the most serious category 1 calls, ambulances should respond on average within 7 minutes. These are life-threatening events that need immediate intervention and/or resuscitation, such as cardiac or respiratory arrest. In 2025/26, the average category 1 response time was 7 minutes 55 seconds – this is 24 seconds faster than in 2024/25 but still 55 seconds above the standard.
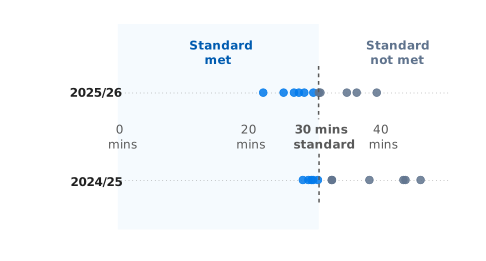
Category 2 calls are serious emergency events that need intervention and/or taking to hospital, including injuries such as burns, epilepsy or strokes. On average, ambulances should respond to category 2 calls within 18 minutes. As part of the plan to recover urgent and emergency care, in January 2023 NHS England raised this to a target of responding in 30 minutes on a temporary basis. In 2025/26, ambulance services were over 5 minutes faster in responding to category 2 calls, with an average response time of 30 minutes 4 seconds. This remains slightly above the revised category 2 standard.
However, the demand for ambulances and performance of ambulance services varies across the country. In 2025/26, data from NHS England Ambulance quality indicators shows:
- The average time taken to answer a call ranged from 1 second to 10 seconds, a slight improvement from 2024/25 where average times ranged from 1 to 14 seconds.
- For category 1 calls, only 2 out of 11 ambulance trusts met the 7-minute standard, with average times varying from 6 minutes 17 seconds to 9 minutes 3 seconds (figure 23).
- For category 2 calls, just over half (6 out of 11) of ambulance trusts met the 30-minute temporary standard with response times ranging from 21 minutes 34 seconds to 38 minutes 51 seconds (figure 24).
Figure 23: Despite an improvement in category 1 response times since 2024/25, only 2 out of 11 ambulance trusts met the 7 minute standard in 2025/26.
Average ambulance response times by NHS ambulance trusts for category 1, 2024/25 and 2025/26.
Source: NHSE Ambulance Quality Indicators, 2024/25 and 2025/26
Figure 24: Average response times for category 2 have improved since 2024/25, but only 6 of 11 ambulance trusts met the standard in 2025/26.
Average ambulance response times by NHS ambulance trusts for category 2 incidents, 2024/25 and 2025/26.
Source: NHS England Ambulance Quality Indicators, 2024/25 and 2025/26
The impact of this variation in performance is reflected in people’s experiences. Analysis of our pathway tracking interviews during our inspections of emergency departments and medical wards in 2025/26 show that some patients had positive experiences, often seeing the service as responsive:
… the patient contacted NHS 111 due to chest pain, back pain, and wheeziness. NHS 111 arranged an ambulance, which arrived within approximately 5 minutes. The ambulance crew carried out an assessment, including observations and an ECG, and determined that the patient needed to be taken to hospital.
(Pathway tracking patient interview)
As well as conveying patients to type 1 and type 2 emergency departments, ambulance services may take patients to alternative healthcare destinations, such as minor injury units. They also provide the following services:
- See and treat – where an ambulance crew responds to a call face-to-face but, following assessment and/or treatment, does not take the patient to hospital.
- Hear and treat – where the ambulance service provides advice over the phone to people who do not have a serious or life-threatening condition.
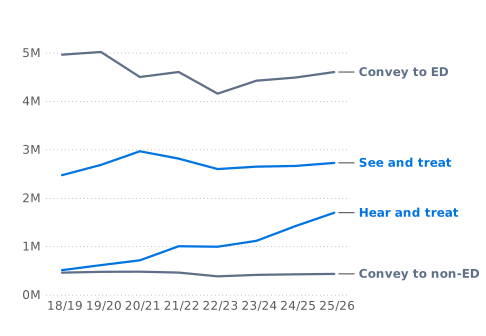
Last year, we reported that the volume of both see and treat, and hear and treat responses had grown, in line with the government’s NHS 10-year health plan to provide patient care and treatment in the appropriate environment and move more care from the hospital into the community. This growth has continued in 2025/26 as the number of see and treat responses increased by 63,000 (2.2%) to 2,723,000 responses. Similarly, compared with 2024/25, there were 276,000 more hear and treat responses (an increase of nearly 20%), increasing to 1,694,000 in 2025/26. This figure has more than tripled since 2018/19 when there were 509,000 responses.
However, despite the increasing use of see and treat and hear and treat, more people are being taken for further care by ambulance due to the growing demand for ambulance services. In 2025/26, the number of people conveyed to hospital by ambulance increased by 123,000 (2.5%) to 5,031,000, of which 4,908,000 were taken to an emergency department (figure 25).
Figure 25: Hear and treat responses continue to grow
Number of responses by type, 2018/19 to 2025/26
Source: NHSE Ambulance Quality Indicators, 2018/19 to 2025/26
Handovers to hospital
As a result of the increased demand for ambulances, the number of people who are transferred from an ambulance into hospital has risen by 107,000 in 2025/26 to 5,063,000 ambulance handovers, up from 4,956,000 in 2024/25.
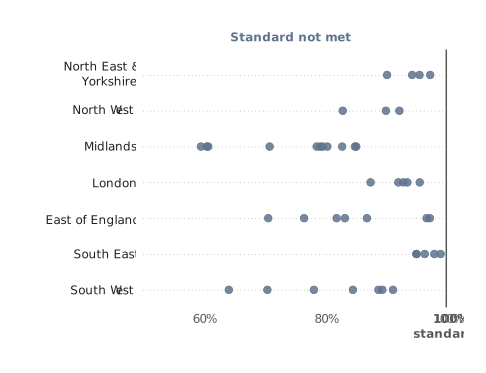
It is important that patients are transferred as quickly as possible into the care of the hospital. Average ambulance handover times have improved nationally – reducing from 34 minutes and 57 seconds in 2024/25 to 29 minutes and 52 seconds in 2025/26. However, the standards set out in the Urgent and Emergency Care Plan 2025/26 were still not met, with only 87.6% of patients transferred within 45 minutes. This varied by integrated care board (ICB) area, ranging from 62.5% of people transferred within 45 minutes in the lowest performing area to 98.8% in the best performing area (figure 26).
Figure 26: A 40-percentage point gap in timely ambulance handovers between integrated care board areas
Percentage of patient handovers completed within 45 minutes by integrated care board within each NHS England region
Source: NHSE Ambulance: Management Information, 2025/26
We interviewed patients to find out about their pathway through care as part of our inspections of emergency departments and medical wards during the winter of 2025/26. Some people told us that they had experienced a relatively timely and smooth handover from the ambulance to the urgent and emergency care department. However, others reported severe delays in handovers, including having to wait over 2 hours to be transferred. These experiences reflected what we found in our analysis of urgent and emergency care inspection reports which showed that, although not universal, ambulance handover delays were a widespread issue.
People we spoke with in our patient pathway tracking interviews also described how their initial treatment had started and continued in the back of the ambulance, due to system pressures, and a lack of available beds and capacity in the emergency department. In one instance, a person told us that they were moved between ambulances while their treatment continued in the vehicle because of overcrowding in the department. This echoes the findings from the 2024 Adult inpatient survey where respondents reported experiencing long waits:
The admission to the hospital was extremely long-lasting. I understand that this happened due to the particularly big number of patients delivered to A&E, so I could understand the situation and do not blame anybody, as the staff is really doing their best to help the situation. My awaiting time was 1 hour in the ambulance in front of A&E…
(Respondent to 2024 Adult inpatient survey)
We have previously warned of the consequences of handover delays. In our 2021/22 State of Care, we cautioned that ambulances are not suitable environments in which to treat people and that handover delays are a consistent risk to the quality and safety of patients’ care. It can also prevent ambulances from responding to emergencies in the community, delaying people with urgent health conditions getting the care they need, when they need it, resulting in serious injury and, in some cases, deaths.
Our analysis of urgent and emergency care inspection reports found that leaders in some services recognised the safety risks and slower response times created by ambulance handover delays, and were taking steps to address the problem, as the following shows:
… ambulance handover performance was strong, with minimal delays over 30 minutes. Senior managers said they prioritised admitting patients from ambulances to avoid delays with patients requiring ambulances in the community. They believed assessing risk inside the department was safer and helped release ambulances to support the wider system.
(From a CQC inspection report)
Handovers to hospital and medicines reconciliation
When people are admitted to any service, any medicines they are currently taking should be accurately listed, known as medicines reconciliation. This needs to happen in a timely way to make sure that people are able to take existing medicine at the right time and that any information, for example about allergies, is recognised. Identifying medicines that are time-critical early reduces the risk of errors and harm to patients.
NICE guideline QS120 states that medicines reconciliation for people in hospital should happen within 24 hours of admission. Through our annual conversations with trust pharmacy teams, we found variation in how trusts managed this process. Several trusts described using prioritisation tools to help them reach the most vulnerable, critical or at-risk people at admission. Another trust told us it assigned a RAG (red, amber, green) rating to all people on admission. This provided guidance to their staff on which people need to be seen within 24, 48 or 72 hours, helping to direct staff resource to areas of greatest clinical need.
Clinical pharmacy services are ideally placed to support hospital teams to obtain, review and document information about medicines during transfer of care. In 2023, the Royal College of Emergency Medicine (RCEM) released a joint statement with the UK Clinical Pharmacy Association, which recommended that emergency departments should have dedicated pharmacists and pharmacy services to work as part of the multidisciplinary team supporting people in the emergency department.
Of the 52 reports published from our inspections of urgent and emergency care services between July 2025 and June 2026, 20 reports referred to the pharmacy RCEM guidance, but none of these 20 emergency departments were meeting the recommendations on pharmacy staffing levels. Although some trusts told us that they prioritised pharmacy staff being based “front of house” such as in emergency departments or acute medical wards, funding these posts was an area of concern.
Continuing pressures on urgent and emergency care services
As we highlighted in our 2024/25 State of Care report, following the fall in attendances at urgent and emergency care services during the pandemic, the number of people attending has been rising year-on-year.
In England there are 3 types of urgent and emergency care services from which people can seek help:
- type 1 – consultant-led 24-hour emergency departments with full resuscitation facilities and patient accommodation (also referred to as accident and emergency (A&E) or casualty)
- type 2 – consultant-led single service facilities for specific conditions, for example eye conditions or dental problems, and patient accommodation
- type 3 – doctor or nurse-led urgent treatment centres for the treatment of minor injuries and illnesses, which are open at least 12 hours a day and can be accessed without appointment, also offering appointments through the NHS 111 service or a GP referral.
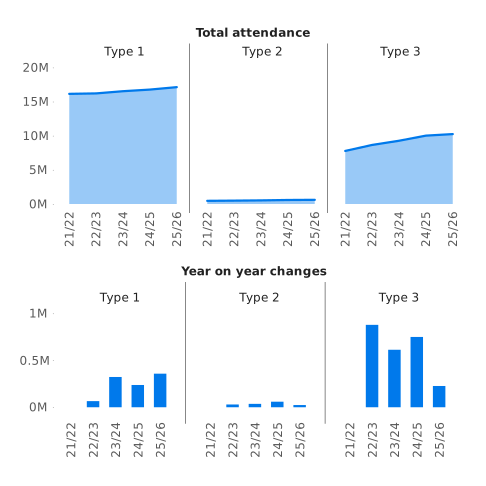
Over the last year, the upward trend in attendances at all types of urgent care services has continued, though at a lower rate. In 2025/26, there were over 608,000 more attendances across type 1, 2 and 3 services, amounting to 28 million attendances compared with 27.4 million 2024/25. We have previously reported how this long-term increase has been largely driven by attendances at type 3 services. However, this year the growth in type 3 attendance appears to have slowed (figure 27).
Figure 27: Pressures on urgent and emergency care services
Total attendances and year-on-year change in urgent and emergency care services at type 1, 2 and 3 services, 2021/22 to 2025/26
Source: NHSE A&E Attendances and Emergency Admissions, 2021/22 to 2025/26
The increase in England’s population may account for some of the growth in attendance at type 1 emergency departments. We continue to see change in who is attending urgent and emergency care, with the greatest increases attendance between 2021/22 and 2025/26 for people aged 65 to 79 (up by 27.7%) and people aged 80 to 89 (up by 24.3%). We also continue to see that demand varies across the country, with attendance higher for people living in the most deprived areas.
The NHS 10-year plan sets out how the government aims to ease pressure on hospitals. Working with the Nuffield Trust, we asked integrated care boards (ICBs) about their confidence in making the ‘three shifts’ outlined in the NHS 10-year plan, including moving more care from hospitals to communities. We received responses from 21 people across 13 ICBs, which means these results are indicative rather than representative of all ICBs.
The survey results showed that respondents’ confidence about the three shifts varied. Results showed:
- Most respondents (19) reported they were at least fairly confident about the ability of their ICB to make better use of technology.
- 17 respondents were at least fairly confident that their ICB would be able to meet the shift to prevention.
- Moving care out of hospitals and into local communities had the lowest number of respondents (16) who were at least fairly confident in their ICB’s ability to deliver. 5 out of 21 said that they were not confident in their ability to make this shift.
We discuss the shift from hospital to community care through a neighbourhood health service further in the section on Patients’ need and capacity in GP services to meet them in this report.
Long waits in urgent and emergency care services
As demand for urgent and emergency care rises, we have seen some small improvements in the performance of the services that provide it. However, we are continuing to hear of people facing extensive waits for urgent and emergency care. Not only are these long waits contributing to poorer experiences for people, but they can also have a negative impact on people’s outcomes from their care. As highlighted in last year’s State of Care report, data from the Office for National Statistics (ONS) showed the risk of death for people needing non-immediate care increased after 2 hours in emergency departments.
The NHS Constitution pledges that 95% of people should wait no longer than 4 hours in urgent and emergency services from arrival to either admission, transfer, or discharge. The NHS Urgent and Emergency Care Plan 2025/26 set a temporary target for 78% of patients to be seen within 4 hours by March 2026 as part of the recovery of urgent and emergency care services.
Over the last year, the number of people waiting less than 4 hours to be either admitted, transferred or discharged has improved, with 74.9% seen within 4 hours across all types of urgent and emergency care services. Performance reached 77.1% by March 2026, but has subsequently declined.
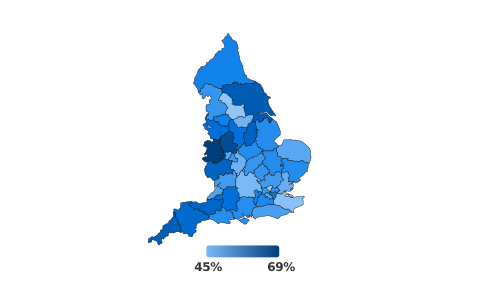
At type 1 services, 60.9% of attendances (10.4 million) were seen in under 4 hours, up from 59.3% (9.9 million) in 2024/25. However, this varied across the country from 44.5% to 69.3%, with no integrated care board area meeting the temporary recovery target (figure 28). The proportion of people seen in 4 hours was better in type 2 services where 95.5% (584,000) attendances waited under 4 hours, and type 3 services where 97.2% (nearly 10 million) attendances waited under 4 hours.
Initiatives such as Same day emergency care (SDEC) could be having an impact on waiting times. Introduced in 2019, SDEC is a model of care that enables people with relevant conditions to be rapidly assessed, diagnosed and treated without being admitted to a ward and, if clinically safe, allows them to go home the same day their care is provided.
Analysis of our urgent and emergency care inspection reports found that SDEC services played an important role in improving patient flow, reducing admissions and providing timely assessment for patients who did not need care as an inpatient. SDEC was most effective when integrated with wider urgent and emergency care pathways, including frailty services, virtual wards and specialty teams. However, its effectiveness still depends on capacity in the wider system and that, during sustained periods of pressure, it remains focused on same-day discharges and does not become an extension of urgent and emergency care departments.
Figure 28: Urgent and emergency care performance varies considerably between ICB areas
Percentage of patients seen within 4 hours across type 1 urgent and emergency care services, by integrated care board areas in 2025/26
Source: NHSE A&E Attendances and Emergency Admissions, 2025/26
We have also seen a marginal improvement in reducing long waits of more than 12 hours from arrival to either admission, transfer, or discharge across type 1 and type 2 services. In 2025/26, 51,000 fewer people had to wait more than 12 hours from the time of their arrival – a fall of 2.8% from 2024/25. However, this still means that 1.76 million people (10%) were waiting for more than 12 hours. This equates to nearly 34,000 people a week.
In contrast with previous years, the number of people who were admitted to hospital after attending an urgent and emergency care service has decreased. In 2025/26, 4.82 million people were admitted to hospital from the 3 main types of urgent and emergency care service, which is just over 52,000 fewer than in 2024/25. The number of people waiting over 4 hours from the decision to admit to admission also decreased. In 2025/26, 1,572,000 (32.6%) of people waited over 4 hours from decision to admit to being admitted, which is 75,000 fewer people than in 2024/25.
However, waits of 12 hours or more from decision to admit to admission have continued to increase. In 2025/26, 571,000 people – more than 1,500 people a day on average – waited more than 12 hours from decision to admit to admission, 38,500 more than in 2024/25. This data is supported by our analysis of urgent and emergency care inspection reports where we found that people experienced long waits at type 1 emergency departments. We also identified inequalities in waiting times, as people presenting with mental health needs experienced longer waits for care than patients with physical health conditions in some urgent and emergency departments (see also section on secondary mental health care).
Patients described long waits in the department… At the time of our assessment, the longest wait was 40 hours, excluding patients with mental health needs who waited significantly longer. Data showed between May 2024 and January 2025 that the average time non-admitted patients spent in the department was over 4 hours and admitted patients was over 32 hours.
(From a CQC inspection report)
People in inappropriate spaces while waiting for beds
Our analysis of urgent and emergency care inspection reports also looked at how services cared for people in urgent and emergency care departments while they were waiting for a bed. This remained a significant operational challenge as the difficulties in maintaining high-quality care were closely linked to overcrowding, delayed admissions and wider system flow pressures. In some cases, these led to patients waiting in emergency departments or corridor escalation areas for prolonged periods.
Patients attending the department often experienced long waits, which increased the risk of deterioration. Between May 2024 and April 2025, 13% of patients waited more than 12 hours. [there are] Longer waits for children and people with mental health conditions.
(From a CQC inspection report)
These findings were supported by feedback through our patient pathway tracking interviews with people during our urgent and emergency care inspections over winter 2025/26. People told us they were left on trollies in corridors for extended periods, often many hours, or they were seated in chairs or put into side rooms. People frequently described the environment of emergency departments as overcrowded and chaotic, with pressures affecting nursing capacity and experience for patients.
These interviews also revealed how people often received treatment under these conditions, sometimes in view of other patients. Other people told us how the overcrowded environments left them experiencing discomfort, a loss of dignity and lack of privacy.
This echoes feedback from respondents to the 2024 Adult inpatient survey, with people describing extended waiting periods as stressful and how they were often not attended to with little or no access to food or drink.
Unfortunately, my time in A&E (waiting for a bed on the ward) was long and uncomfortable. It was very busy, noisy and the nurses were rushed off their feet. I was fortunate to be well enough to advocate for myself but I witness elderly patients being left without food and water for long periods of time.
(Feedback from the 2024 Adult inpatient survey
In February 2026, NHS England published its guidance The Model Emergency Department: high performing urgent and emergency care pathways. Recognising the longstanding challenges facing emergency departments, and the need for an overall system effort to improve urgent and emergency care, the guidance focuses on elements within the control of emergency departments and sets out opportunities for good practice in internal emergency department pathways.
Analysis of our urgent and emergency care inspection reports highlighted the steps some trusts are taking to address the pressure in urgent and emergency care and prevent people receiving care in inappropriate spaces. For example, at one trust staff assessed people quickly and transferred them as soon as possible if they needed more specialist care. Data from the trust showed that between February 2025 and January 2026, the service met the national performance standard to admit, transfer or discharge 78% of patients within 4 hours of their arrival in the emergency department. It also had a ‘no corridor care’ approach for people who needed to be admitted to hospital.
The premises and facilities supported the delivery of safe care. Patients were allocated to different areas of care depending on the severity of their condition: resuscitation unit, majors, ambulatory majors, UTC and the GP centre. Areas were well maintained and monitored to deliver safe care. Patients were not cared for in non-designated areas, such as corridors throughout the period of our inspection.
(From a CQC inspection report)
In April 2026, the government announced that NHS trusts with the highest levels of corridor care would receive tailored support from the Getting it Right First Time (GIRFT) team. This involves providing bespoke clinical support to leaders to identify how to improve the flow and discharge of patients, helping trusts to understand their own data to improve how they can predict surges in demand, and supporting clinical leaders to improve their decision making.
The State of Emergency Medicine in England report by the Royal College of Emergency Medicine, published in June 2026, highlights the impact of long waits, high bed occupancy and a lack of patient flow on patient safety. The report describes how these challenges are continuing to lead to overcrowded emergency departments, and how long waits are closely linked to an increased chance of death within the following 30 days. As we describe below, one of the principal reasons why people are kept waiting for so long is because of a lack of available beds.