Homecare providers – prevalence of COVID-19
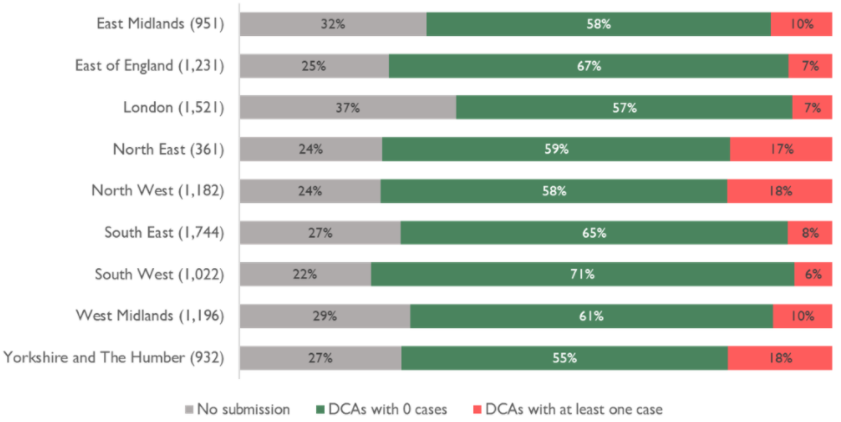
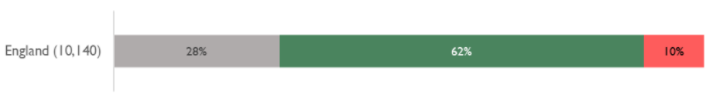
Source: CQC Domiciliary Care Agency Survey. Homecare providers with at least one case include suspected AND confirmed cases. Numbers in brackets show number of services that are primarily homecare providers in the region. Included in these figures are homecare services currently lying dormant, so completion rates are slightly higher for fully active services than this might suggest. Percentages may not add to 100% due to rounding.
Homecare providers – availability of all PPE
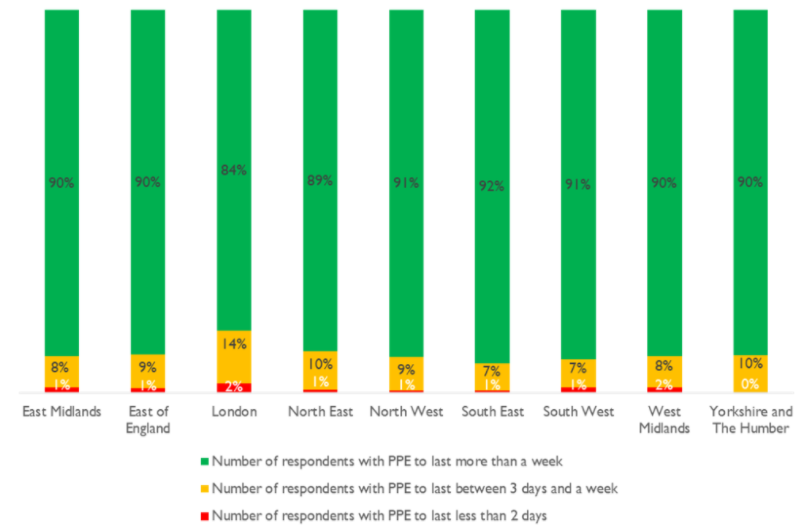
Source: CQC Domiciliary Care Agency survey – latest response in period 2-8 November 2020.
Homecare providers – staff absence
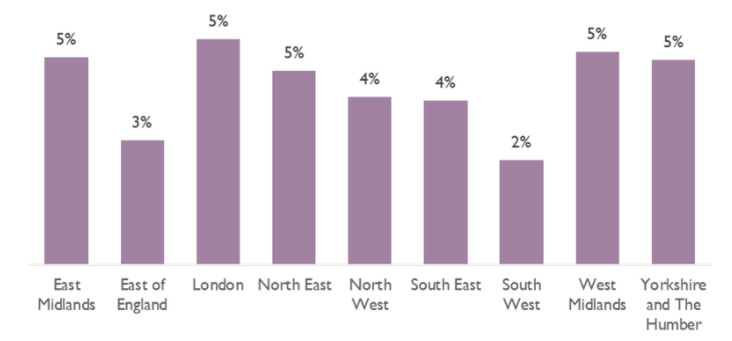
Source: CQC Domiciliary Care Agency survey – latest response in period 2-8 November 2020. Includes staff who are self-isolating or have care commitments. England average: 4%.
Deaths notified by care homes
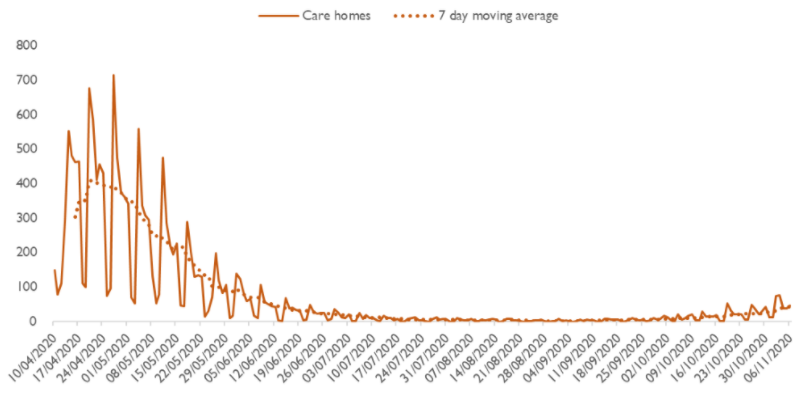
Source: CQC death notifications submitted 10/04/2020 to 06/11/2020

Source: CQC death notifications submitted 10 April 2020 to 6 November 2020.
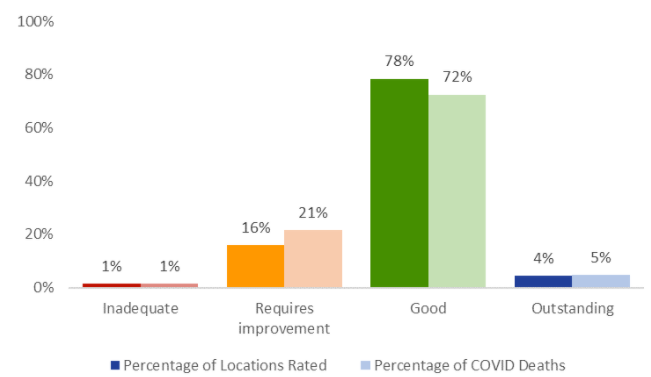
Deaths of people in care homes, by ratings
We have used two methods to examine deaths in care homes, where confirmed or suspected COVID-19 was flagged on the notification form, in relation to ratings. Below we show the percentage of all care home deaths notified to CQC within each rating band, compared with the overall distribution of ratings. For example, 21% of deaths occurred at care homes rated as requires improvement, compared with 16% of care homes that currently hold that rating.
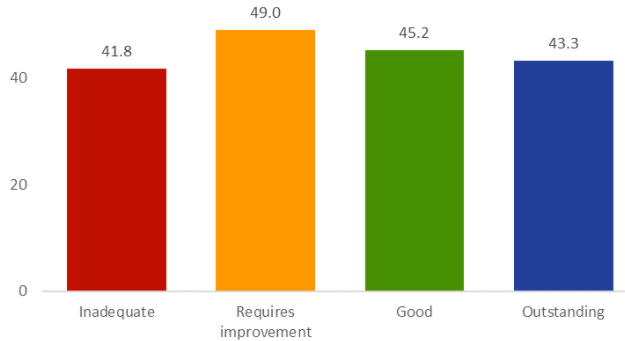
The second analysis shows the rate of deaths per 1,000 beds by care home rating, which updates figures previously included in our State of Health and Adult Social Care in England, 2019/20 (page 47).
Both charts reflect a slight skew towards requires improvement, but there is no clear correlation between the number of deaths and overall rating.
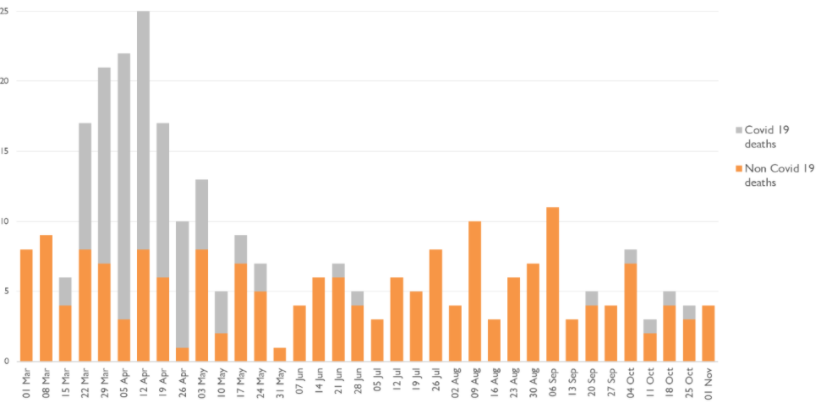
Deaths of people detained under the Mental Health Act
All providers registered with CQC must notify us about deaths of people who are detained, or liable to be detained, under the MHA. From 1 March to 6 November 2020, we have been notified of 102 deaths that mental health providers indicated were suspected or confirmed to be related to COVID-19. A further five COVID-19 related deaths of detained patients were reported by other (non-mental health) providers.
People liable to be detained includes detained patients on leave of absence, or absent without leave, from hospital, and conditionally discharged patients. ‘Detained patients’ also includes patients subject to holding powers such as sections 4, 5, 135 or 136, and patients recalled to hospital from community treatment orders. These counts may also include notifications about the deaths of people subject to the MHA who are in the community and not in hospital.
Data on notifications may be updated over time and therefore successive extracts may lead to changes in overall numbers unrelated to new cases.
The chart shows the number of deaths by week of death.
Of the 304 notifications from mental health providers in the 2020 period (covering all causes of death), 240 were from NHS organisations, of which 76 deaths were indicated as being COVID-19-related, and 64 were from independent providers, of which 26 deaths were COVID-19-related.
We have identified 16 detained patients whose deaths have been notified to us from 1 March to 6 November 2020 who had a learning disability and/or were autistic: the majority were not identified as related to confirmed or suspected COVID-19. Of these people, most also had a mental health diagnosis. Please note that these patients were identified both from a specific box being ticked on the notification form and a review of diagnoses in the free text of the form.
| Age band | 18-24 | 25-34 | 35-44 | 45-54 | 55-64 | 65-74 | 75-84 | 85+ | Unknown | Total |
|---|---|---|---|---|---|---|---|---|---|---|
| Suspected or confirmed COVID-19 | 1 | 1 | 4 | 6 | 14 | 20 | 33 | 19 | 9 | 107 |
| Not COVID-19 | 8 | 15 | 14 | 26 | 39 | 40 | 29 | 13 | 37 | 221 |
| Total | 9 | 16 | 18 | 32 | 53 | 60 | 62 | 32 | 46 | 328 |
| Gender | Female | Male | Unknown or unspecified | Total |
|---|---|---|---|---|
| Suspected or confirmed COVID-19 | 35 | 61 | 11 | 107 |
| Not COVID-19 | 70 | 111 | 40 | 221 |
| Total | 105 | 172 | 51 | 328 |
| Ethnicity | Suspected or confirmed COVID-19 | Not COVID-19 |
|---|---|---|
| Asian | 3 | 4 |
| Black | 12 | 20 |
| Mixed | 1 | 3 |
| Other ethnic groups | 0 | 1 |
| White | 65 | 110 |
| Unknown | 23 | 70 |
| Not stated | 3 | 13 |
| Total | 107 | 221 |
| Place of death | Suspected or confirmed COVID-19 | Not COVID-19 |
|---|---|---|
| Medical ward | 62 | 66 |
| Psychiatric ward | 34 | 65 |
| Hospital grounds | 1 | 6 |
| Patient’s home | 0 | 18 |
| Public place | 0 | 4 |
| Other | 1 | 26 |
| Not stated | 9 | 36 |
| Total | 107 | 221 |
Deaths of people with a learning disability
In June 2020, we published new data on the number of deaths of people who were receiving care from services that provide support for people with a learning disability and/or autism between 10 April and 15 May 2020. We have now updated this analysis for the period 10 April to 30 September.
We received notifications of the deaths of 970 people with a learning disability or autism from services identified as caring for people with learning disabilities or autism. This is 41% higher than the 687 deaths notified in the comparable period in 2019.
Of the 970 people who have died during the period this year, 263 were as a result of suspected or confirmed COVID-19 as notified by the provider, and 707 were not identified as related to COVID-19.
As we noted in our previous briefing, we know that people with a learning disability are at an increased risk of respiratory illnesses and in November 2020 Public Health England published a report highlighting this issue further in relation to the impact on rates of death with COVID-19 of people with a learning disability. In March 2020, NHS England highlighted how people with a learning disability have higher rates of morbidity and mortality than the general population, and die prematurely. In 2018/19, at least 41% of people with a learning disability who died, died as a result of a respiratory condition. They have a higher prevalence of asthma and diabetes, and of being obese or underweight; all these factors make them more vulnerable to coronavirus. Our figures show that the impact on this group of people is being felt at a younger age range than in the wider population.
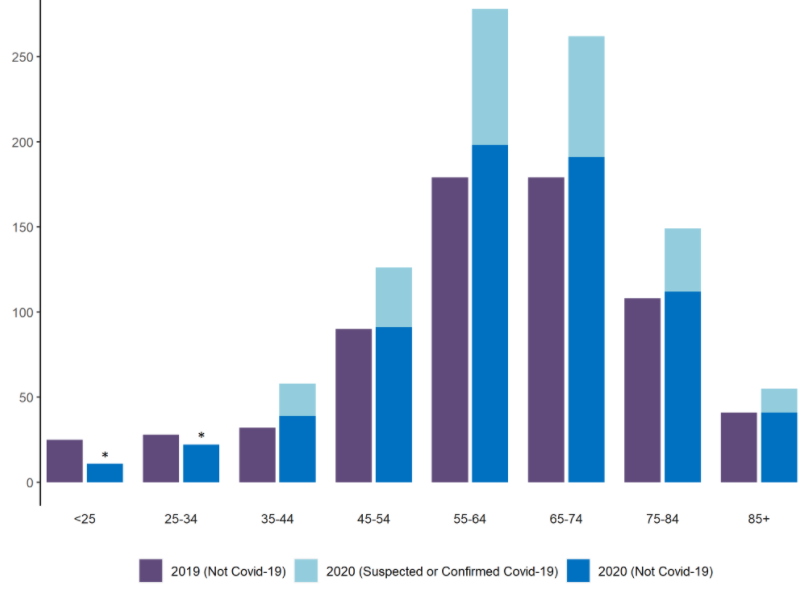
*Denotes bars where data has been suppressed due to low numbers. Source: notifications of deaths under Statutory Notification 16 to CQC, 10 April to 30 September 2020, and comparable period in 2019
Of the 970 people who died, 948 were received from adult social care settings.
| Type of adult social care setting | Confirmed or Suspected Covid | Not Covid | Total |
|---|---|---|---|
| Community based adult social care services | 124 | 345 | 469 |
| Residential social care | 135 | 344 | 479 |
We only show this breakdown of service types for adult social care. The remaining 22 deaths were of people notified to us by types of service in numbers less than 10; to avoid identifying individuals we have not included them here.
Deaths of people from Black and minority ethnic groups in adult social care settings
In our second COVID-19 insight briefing we published exploratory data on the ethnicity (where known) of people whose death in adult social care settings was notified to us between 10 April and 15 May 2020.
We have now updated this analysis to 30 September 2020. As we noted previously, the ethnic category fields in the notification forms are not mandatory, and for the period in question this information was missing in 12.8% of forms, which was a slight improvement on the 13.8% we observed in the period to 15 May.
Of deaths with a known ethnicity, 96% of those notified during this period were White, with Mixed, Asian and Black all just over 1% each, and ‘Other’ less than 0.5%. Therefore while the vast majority of deaths in these settings were of White people, once again we found that Black people in particular who died were more likely than White people to die with confirmed or suspected COVID-19 flagged on their notification form. The chart shows that 23% of White people who died were flagged as confirmed or suspected COVID-19, compared with 28% of Black people.
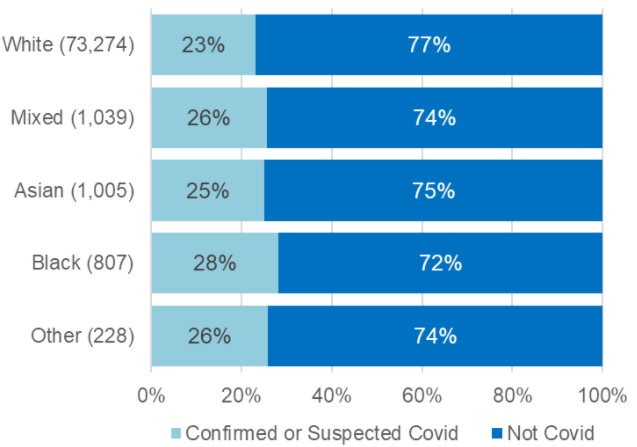
Source: notifications of deaths under Statutory Notification 16 to CQC, 10 April to 30 September 2020
If we look only at care homes, this pattern is slightly more distinct. The chart shows that while 25% of White people who died were flagged as confirmed or suspected COVID-19, for Black people who died the figure was 34%. It should be noted that all these figures are somewhat lower than the percentages we reported for the period 10 April to 15 May – this is to be expected because the new time period covers a much longer period after the first wave of COVID-19 subsided.
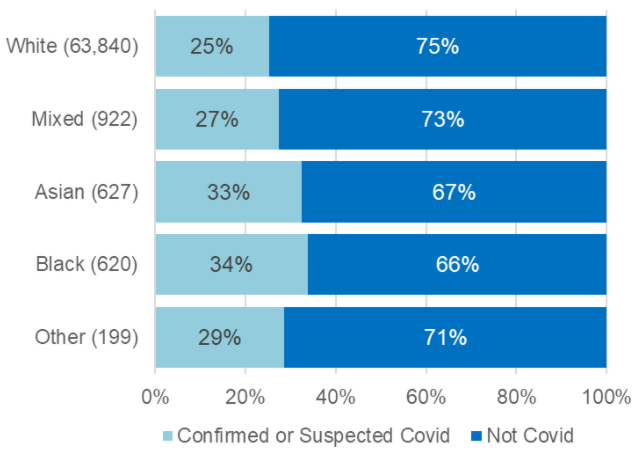
Source: notifications of deaths under Statutory Notification 16 to CQC, 10 April to 30 September 2020
ONS data on all weekly deaths in England (COVID and non-COVID) compared with the average for 2015-2019
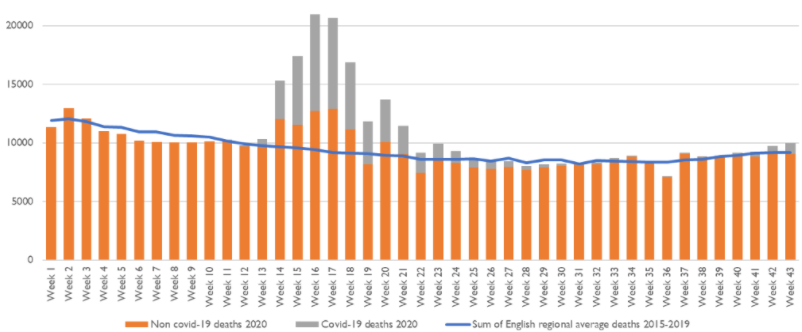
Source: ONS COVID/non-COVID 2020 death data and 2015-2019 death data. Week 43: week ending 23 October 2020.