Homecare providers – prevalence of COVID-19
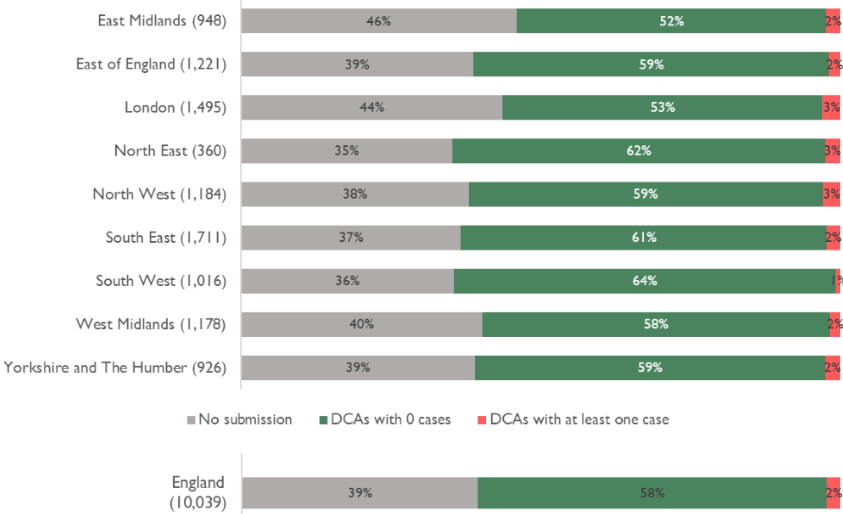
Source: CQC Domiciliary Care Agency Survey. Homecare providers with at least one case include suspected AND confirmed cases. Numbers in brackets show number of services that are primarily homecare providers in the region. Included in these figures are homecare services currently lying dormant, so completion rates are slightly higher for fully active services than this might suggest. Percentages may not add to 100% due to rounding.
Homecare providers - availability of all PPE
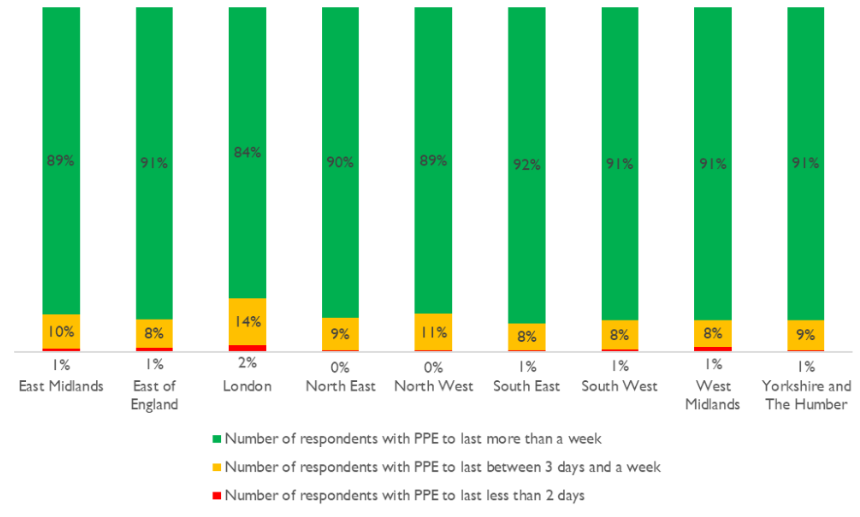
Source: CQC Domiciliary Care Agency Survey – latest response in period 30 August – 5 September inclusive.
Homecare providers – staff absence
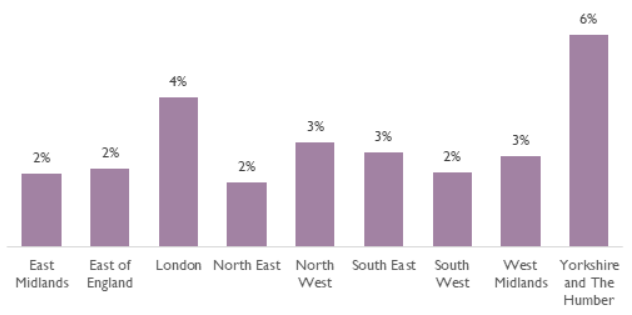
Source: CQC Domiciliary Care Agency survey – latest response in period 30 August – 5 September inclusive. Includes staff who are self-isolating or have care commitments. England average: 3%.
Deaths notified by care homes
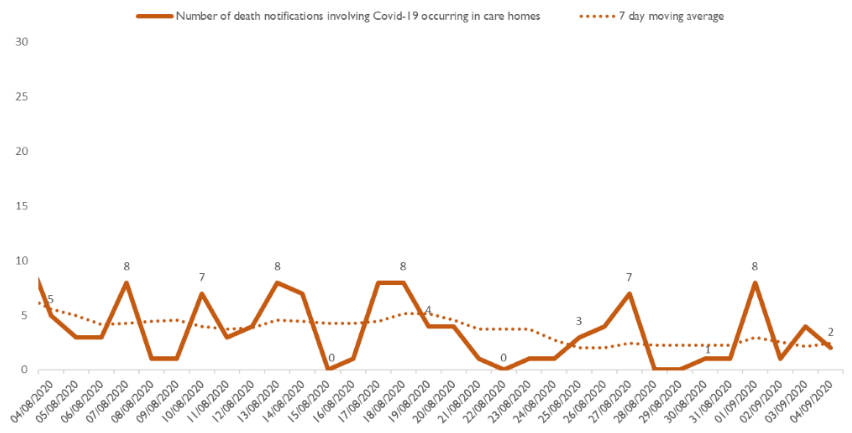
Source: CQC Death Notifications submitted 4 August to 4 September 2020.
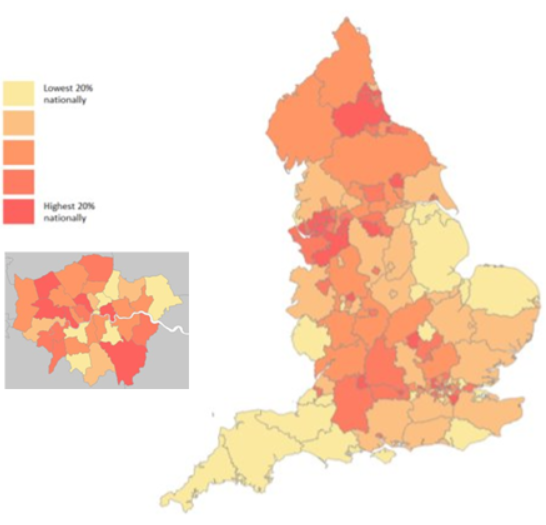
Source: CQC death of service user notifications from 10 April to 4 September 2020. For this map, notifications are of deaths no matter where the resident died, so it includes deaths in hospitals and hospices.
Deaths of people detained under the Mental Health Act
All providers registered with CQC must notify us about deaths of people who are detained, or liable to be detained, under the MHA. From 1 March to 4 September 2020, we have been notified of 94 deaths that mental health providers indicated were suspected or confirmed to be related to COVID-19. A further three COVID-19 related deaths of detained patients were reported by other (non-mental health) providers.
The chart below shows the number of deaths by week of death. To date there have been no notifications of any COVID-19 related deaths that have occurred after 4 July; however, this could change due to time lags in providers submitting notifications and/or identifying that a particular death was COVID-19 related.
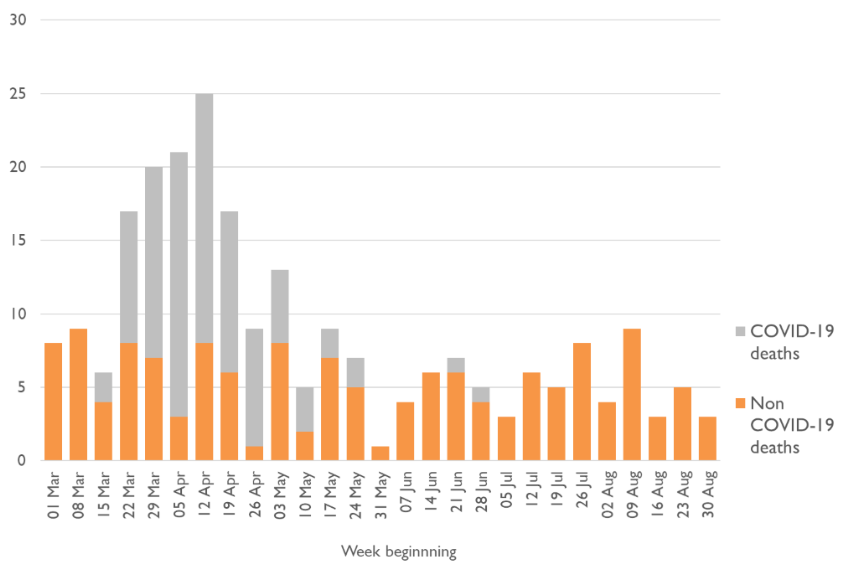
Of the 239 notifications from mental health providers in the 2020 period (covering all causes of death), 188 were from NHS organisations, of which 68 deaths were indicated as being COVID-19-related, and 51 were from independent providers, of which 26 deaths were COVID-19-related.
We have identified 13 detained patients whose deaths have been notified to us from 1 March to 4 September 2020 who had a learning disability and/or were autistic: the majority were not identified as related to confirmed or suspected COVID-19. Of these people, most also had a mental health diagnosis. Please note that these patients were identified both from a specific box being ticked on the notification form and a review of diagnoses in the free text of the form.
| Age band | 18-24 | 25-34 | 35-44 | 45-54 | 55-64 | 65-74 | 75-84 | 85+ | Unknown | Total |
|---|---|---|---|---|---|---|---|---|---|---|
| Suspected or confirmed COVID-19 | 1 | 1 | 4 | 6 | 13 | 18 | 30 | 18 | 6 | 97 |
| Not COVID-19 | 6 | 13 | 8 | 23 | 29 | 29 | 20 | 11 | 13 | 152 |
| Total | 7 | 14 | 12 | 29 | 42 | 47 | 50 | 29 | 19 | 249 |
| Female | Male | Unknown or not specified | Total | |
|---|---|---|---|---|
| Suspected or confirmed COVID-19 | 34 | 55 | 8 | 97 |
| Not COVID-19 | 49 | 88 | 15 | 152 |
| Total | 83 | 143 | 23 | 249 |
| Ethnicity | Suspected or confirmed COVID-19 | Not COVID-19 |
|---|---|---|
| Asian | 3 | 1 |
| Black | 11 | 11 |
| Mixed | 1 | 4 |
| Other ethnic groups | 0 | 1 |
| White | 60 | 85 |
| Unknown | 12 | 20 |
| Not stated | 10 | 30 |
| Total | 97 | 152 |
| Place of Death | Suspected or confirmed COVID-19 | Not COVID-19 |
|---|---|---|
| Medical ward | 57 | 48 |
| Psychiatric ward | 32 | 48 |
| Hospital grounds | 1 | 4 |
| Patient’s home | 0 | 15 |
| Public place | 0 | 2 |
| Other | 1 | 22 |
| Not stated | 6 | 13 |
| Total | 97 | 152 |
ONS data on all weekly deaths in England
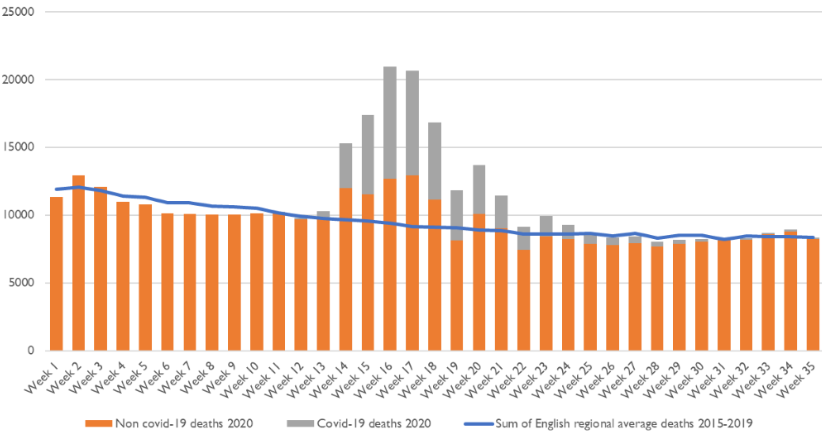
Source: ONS COVID/non-COVID 2020 death data and 2015-2019 death data. Week 35: week ending 28 August 2020.