Designated settings
In the last edition of this Insight series, we shared findings and good practice from our inspections of care homes in August and September 2020, which looked at how care homes managed infection prevention and control (IPC).
We have continued this focus by carrying out over 500 IPC inspections in October and November, measuring assurance against eight questions. The results of these inspections are published on our website.
Increasingly, these have included inspections of designated locations. These inspections are in support of a scheme led by the Department of Health and Social Care to allow people with a COVID-positive test result to be discharged safely from hospital.
The Department has asked local authorities to speak to local care providers and find suitable designated locations for people to be safely discharged to. Once these locations have been identified, we then assess the location with an IPC inspection and a specific focus on a service’s ability to zone COVID-19 positive residents with a dedicated workforce and high levels of ventilation.
In addition to these, some local authorities have agreed with local NHS partners to make use of ‘alternative’ NHS settings to fulfil the role of a designated setting.
We provide a weekly update on the number of assured designated locations on this website.
The Government’s aim is for each local authority to have access to at least one designated setting as soon as possible.
Now that the designation scheme is up and running, we can look at numbers of approved settings across regions. The table below shows the number of designated beds and those covered by alternative arrangements per 100 care home beds, per 100,000 people over 65 in each region and measured against the average COVID infection rate per 100,000 people.
The table shows that there is wide variation. For example, the lowest figure of designated beds per 100 care home beds is in the South East (0.19) and the highest figure is in London (1.00). There is a similar level of variation by looking at the number of designated beds against the number of people over 65.
By comparing the provision of approved designated beds against the average regional rate of infection in the population, these differences are reduced, although by no means entirely. For example, the ratio of approved designated beds to infection rate in the South West and South East is around a half or less of the ratio for North East and Yorkshire, Midlands and London. This suggests a potential shortage of provision in the South West and South East.
| Region | No. of beds in approved designated settings & alternative arrangements | Ratio of beds in designated settings & alternative arrangements to 100 care home beds | Ratio of beds in designated settings & alternative arrangements to 100,000 people 65+ | Ratio of beds in designated settings & alternative arrangements to average infection rate per 100,000 population tested under Pillar 1 and 2 (week 48) |
|---|---|---|---|---|
| East of England | 211 | 0.38 | 14.39 | 1.74 |
| London | 356 | 1.00 | 32.92 | 2.36 |
| Midlands | 510 | 0.57 | 27.88 | 2.76 |
| North East and Yorkshire |
545 | 0.70 | 32.74 | 2.90 |
| North West | 272 | 0.45 | 20.80 | 1.81 |
| South East | 162 | 0.19 | 9.25 | 1.24 |
| South West | 114 | 0.21 | 9.09 | 1.22 |
We have also analysed regional provision of approved designated beds against recent rates of hospital admission for COVID-19 and found similar patterns.
It is important to note that these figures do not show the full picture. Although we have included figures for alternative arrangements where we have the relevant information, these may not be complete. Designated settings are continually being submitted, considered and inspected, and infection rates are constantly changing, so all these figures will change over time. However, these figures are helping to inform the conversations about designated settings that are taking place in each local area.
Care home capacity
In our July edition of this Insight report, we highlighted concerns about the financial viability of some care homes due to the ongoing impact of the pandemic. At that time, analysis from our Market Oversight function indicated that recovery in care home admissions was slower for self-funded places compared with admissions funded by local authorities. We said that this could put added financial pressure on homes that are more reliant on people who fund their own care.
For care homes that fall within the Market Oversight scheme (approximately 30% of the total care home sector), occupancy levels were on average 87% prior to the pandemic. These levels are estimated to have reduced by around 10% at the height of the first wave of the pandemic. While average occupancy levels increased over summer to approximately 80%, they remain considerably below normal and may fall again.
An Association of Directors of Adult Social Services (ADASS) report in June said that a quarter of directors were concerned about the financial sustainability of most of their residential and nursing providers following the pandemic.
We have looked at the latest data from our register of care homes, and this shows that the total number of registered care home beds is still relatively unchanged. The total number of care home beds across the country at 1 November 2020 was 457,636 compared with 456,892 at 1 March 2020. This shows a very small increase in beds (less than 0.2%).
Financial challenges do not yet appear to have given rise to home closures, but it is unlikely that this can be maintained if occupancy levels decline over the long term. In their June report, ADASS said reported that, as a result of COVID-19, around three-quarters of councils had seen a drop in occupancy of residential and nursing homes used mainly by state-funded residents, and over half had seen a decline in occupancy in homes mainly for self-funders.
This stability in registered provision at national level to some extent masks some more marked changes at local level, particularly when nursing homes are distinguished from residential homes (see figure 2).
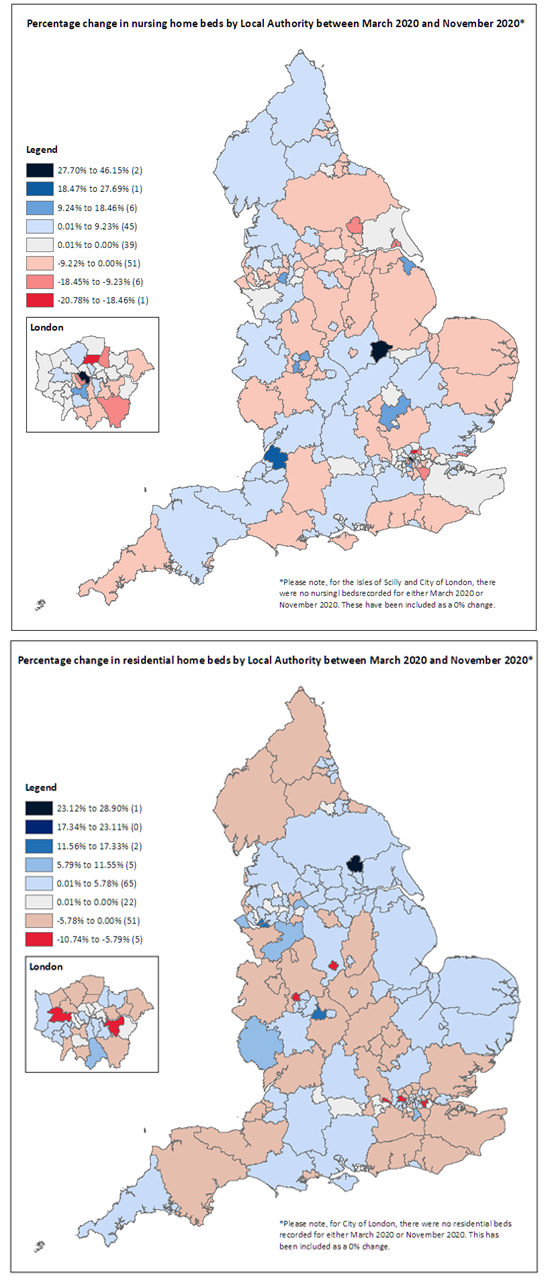
Source: CQC register
Areas of the maps shaded tan to red indicate a reduction in the number of beds within the local authority area, and shades of blue indicate an increase. Comparing the nursing and residential homes maps side by side it can be seen that some areas have seen an increase in nursing home capacity at the same time as a reduction in residential home capacity (for example Cumbria, Northumberland, Devon and Somerset), while others have seen the reverse trend (parts of Yorkshire, Norfolk, Suffolk and Cornwall).
There is some indication that such trends may be driven by services in some areas changing their registration from nursing homes to residential homes or vice versa. There are 19 local authorities that have seen at least one home change registration from nursing to residential, accounting for more than 1,000 beds. In comparison, there are four local authorities that have seen at least one home change from residential to nursing, accounting for around 240 beds.
Although the long-term trend has been that numbers of residential homes have been reducing at a faster rate than nursing homes, these recent figures show that almost all the overall increase in the number of beds was in residential homes (703 beds) rather than nursing homes (41 beds). This could be linked to workforce challenges that we flagged in State of Care, with the recruitment of nurses a particular challenge. A potential reduction in nursing home provision is concerning, as it is vital for the care and support of people with high support needs, including people living with dementia.
Other parts of the country have seen either a reduction in both nursing and residential capacity (including East and West Sussex, Bromley, and Nottinghamshire), or an increase (such as Hampshire, Oxfordshire, Cambridgeshire and Lancashire).