Homecare providers – prevalence of COVID-19
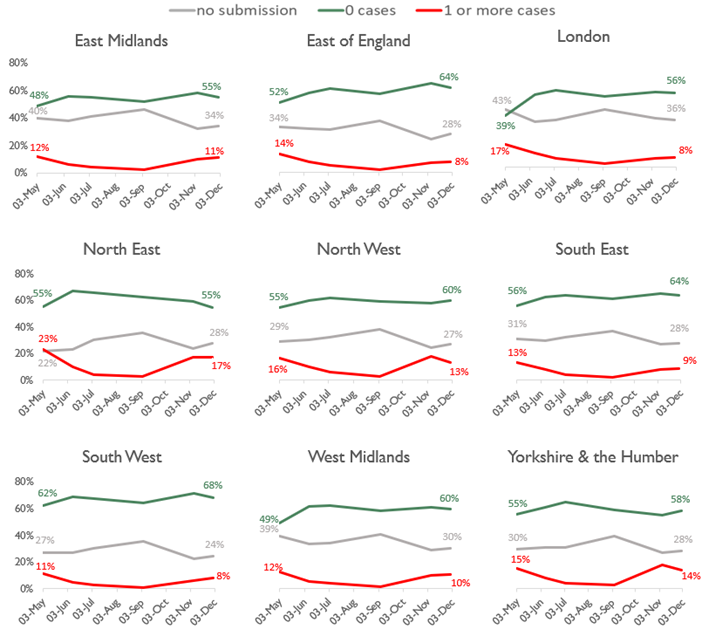
Source: CQC Domiciliary Care Agency Survey, data extracts from 3 May to 2 December 2020.
Homecare providers – availability of all PPE
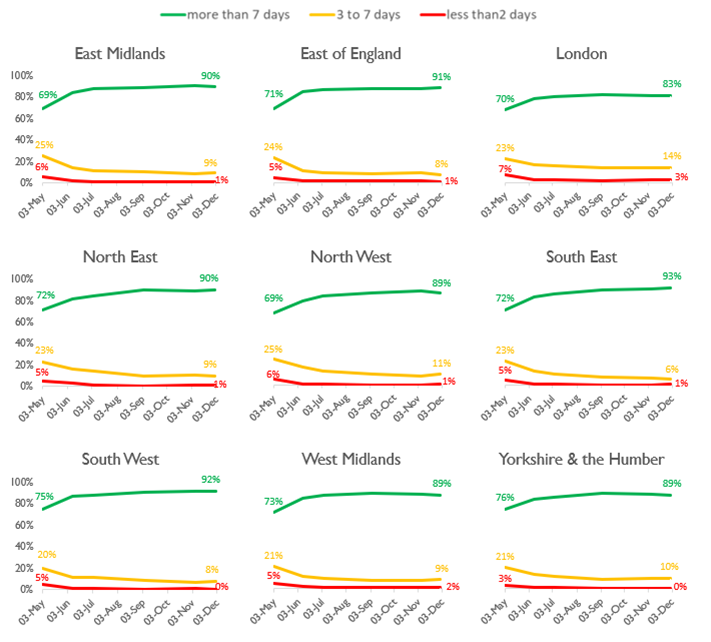
Source: CQC Domiciliary Care Agency survey – data extracts from 3 May to 2 December 2020.
Homecare providers – staff absence
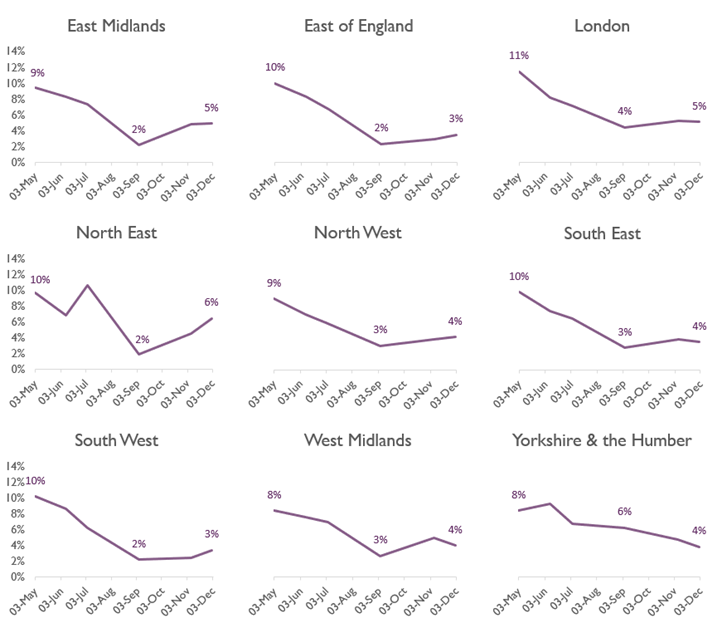
Source: CQC Domiciliary Care Agency survey, data extracts from 3 May to 2 December 2020. Includes staff who are self-isolating or have care commitments.
Deaths notified by care homes
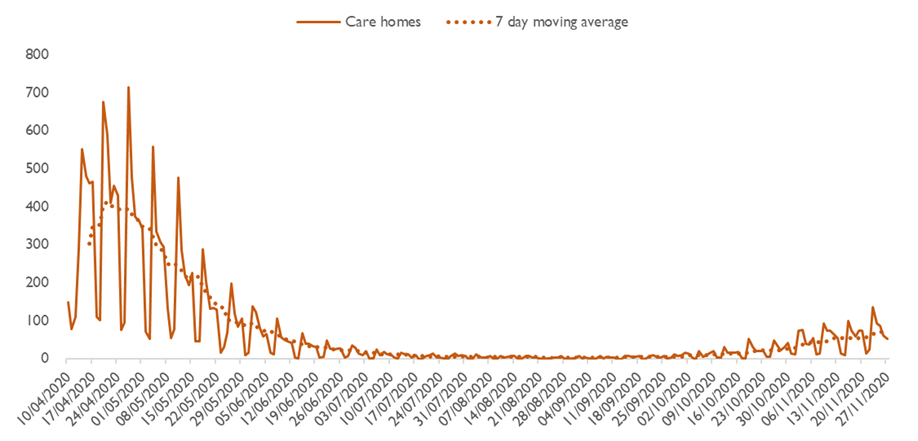
Source: CQC death notifications submitted 10 April 2020 to 27 November 2020.
Deaths of people detained under the Mental Health Act
All providers registered with CQC must notify us about deaths of people who are detained, or liable to be detained, under the MHA. This includes detained patients on leave of absence, or absent without leave, from hospital, and conditionally discharged patients. ‘Detained patients’ also includes patients subject to holding powers such as sections 4, 5, 135 or 136, and patients recalled to hospital from CTO. These counts may also include notifications about the deaths of people subject to the MHA who are in the community and not in hospital.
From 1 March to 27 November 2020, we have been notified of 106 deaths that mental health providers indicated were suspected or confirmed to be related to COVID-19 (an increase of four since we reported in November). A further five COVID-19 related deaths of detained patients were reported by other (non-mental health) providers (no increase since we last reported). The data on notifications may be updated over time and therefore successive extracts may lead to changes in overall numbers unrelated to new cases.
The chart shows the number of deaths by week of death.
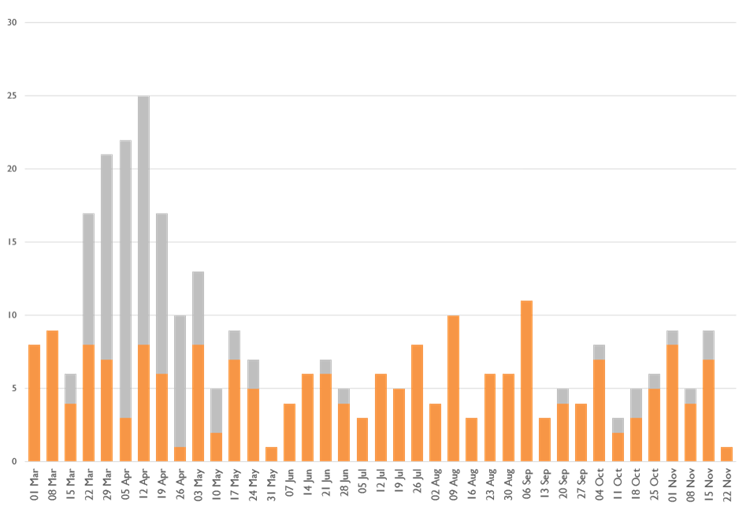
Of the 321 notifications from mental health providers in the 2020 period (covering all causes of death), 250 were from NHS organisations, of which 77 deaths were indicated as being COVID-19-related, and 71 were from independent providers, of which 29 deaths were COVID-19-related.
We have identified 16 detained patients whose deaths have been notified to us from 1 March to 27 November 2020 who had a learning disability and/or were autistic: the majority were not identified as related to confirmed or suspected COVID-19 (no change on our report in November). Of these people, most also had a mental health diagnosis. Please note that these patients were identified both from a specific box being ticked on the notification form and a review of diagnoses in the free text of the form.
| Age band | 18-24 | 25-34 | 35-44 | 45-54 | 55-64 | 65-74 | 75-84 | 85+ | Unknown | Total |
|---|---|---|---|---|---|---|---|---|---|---|
| Suspected or confirmed COVID-19 | 1 | 1 | 4 | 6 | 16 | 21 | 34 | 20 | 8 | 111 |
| Not COVID-19 | 9 | 16 | 16 | 33 | 42 | 40 | 33 | 13 | 33 | 235 |
| Total | 10 | 17 | 20 | 39 | 58 | 61 | 67 | 33 | 41 | 346 |
| Gender | Female | Male | Unknown or unspecified | Total |
|---|---|---|---|---|
| Suspected or confirmed COVID-19 | 38 | 63 | 10 | 111 |
| Not COVID-19 | 73 | 125 | 37 | 235 |
| Total | 111 | 188 | 47 | 346 |
| Ethnicity | Suspected or confirmed COVID-19 | Not COVID-19 |
|---|---|---|
| Asian | 4 | 6 |
| Black | 12 | 22 |
| Mixed | 1 | 3 |
| Other ethnic groups | 1 | 2 |
| White | 68 | 138 |
| Unknown | 22 | 54 |
| Not stated | 3 | 10 |
| Total | 111 | 235 |
| Place of death | Suspected or confirmed COVID-19 | Not COVID-19 |
|---|---|---|
| Medical ward | 66 | 70 |
| Psychiatric ward | 35 | 70 |
| Hospital grounds | 1 | 6 |
| Patient’s home | 0 | 22 |
| Public place | 0 | 5 |
| Other | 1 | 29 |
| Not stated | 8 | 33 |
| Total | 111 | 235 |
Deaths of people with a learning disability
In June 2020, we published new data on the number of deaths of people who were receiving care from services that provide support for people with a learning disability and/or autism between 10 April and 15 May 2020. In our fifth Covid Insight briefing we updated this analysis for the period 10 April to 30 September, and have now extended this to 16 November 2020.
We received notifications of the deaths of 1,205 people with a learning disability or autism from services identified as caring for people with learning disabilities or autism between 10 April and 16 November. This is 35% higher than the 892 deaths notified in the comparable period in 2019.
Of the 1,205 people who have died during the period this year, 302 were as a result of suspected or confirmed COVID-19 as notified by the provider, and 903 were not identified as related to COVID-19.
We provided further contextual discussion in relation to this in our last briefing.
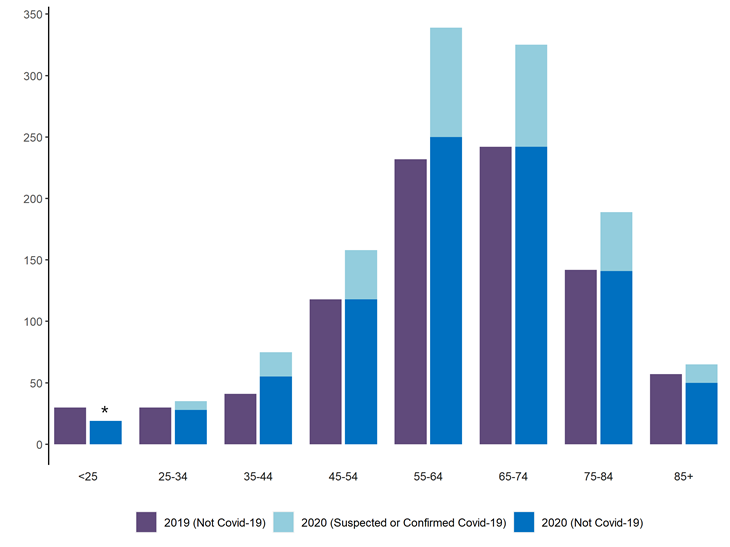
*The data for the under-25 group has been suppressed due to low numbers. Source: notifications of deaths under Statutory Notification 16 to CQC, 10 April to 16 November 2020, and comparable period in 2019.
Of the 1,205 people who died, 1,180 were received from adult social care settings.
| Type of adult social care setting | Confirmed or Suspected Covid | Not Covid | Total |
|---|---|---|---|
| Community based adult social care services | 147 | 440 | 587 |
| Residential social care | 152 | 441 | 593 |
We only show this breakdown of service types for adult social care. The remaining 25 deaths were of people notified to us by types of service in numbers less than 10; to avoid identifying individuals we have not included them here.
Deaths of people from Black and minority ethnic groups in adult social care settings
In our second COVID-19 insight briefing we published exploratory data on the ethnicity (where known) of people whose death in adult social care settings was notified to us between 10 April and 15 May 2020. We then updated this in our fifth briefing to 30 September 2020.
We have now updated this analysis to 16 November 2020. As we noted previously, the ethnic category fields in the notification forms are not mandatory, and for the period in question this information was missing in 12.8% of forms, the same level as in our previous update.
Of deaths with a known ethnicity, 96% of those notified during this period were White, with Mixed, Asian and Black all just over 1% each, and ‘Other’ less than 0.5%. Therefore while the vast majority of deaths in these settings were of White people, once again we found that Black people in particular who died were more likely than White people to die with confirmed or suspected COVID-19 flagged on their notification form. The chart shows that 21% of White people who died were flagged as confirmed or suspected COVID-19, compared with 25% of Black people.

Source: notifications of deaths under Statutory Notification 16 to CQC, 10 April to 16 November 2020.
If we look only at care homes, this pattern is slightly more distinct. The chart shows that while 23% of White people who died were flagged as confirmed or suspected COVID-19, for Black people who died the figure was 31%. It should be noted that all these figures have fallen slightly since we first reported for the period 10 April to 15 May – this is to be expected because the new time period covers a much longer period after the first wave of COVID-19 subsided.
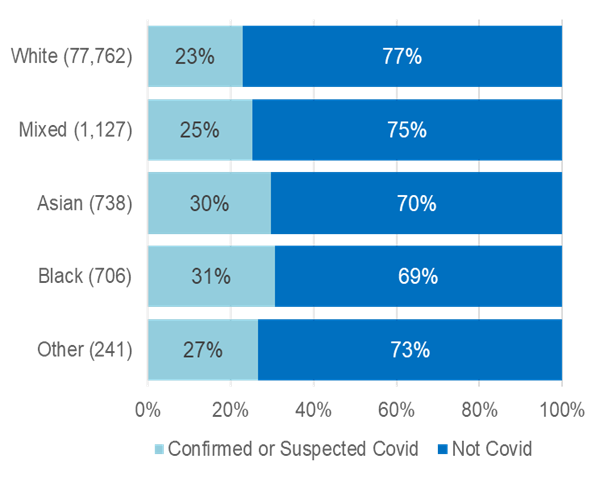
Source: notifications of deaths under Statutory Notification 16 to CQC, 10 April to 16 November 2020.
ONS data on all weekly deaths in England (COVID and non-COVID) compared with the average for 2015-2019
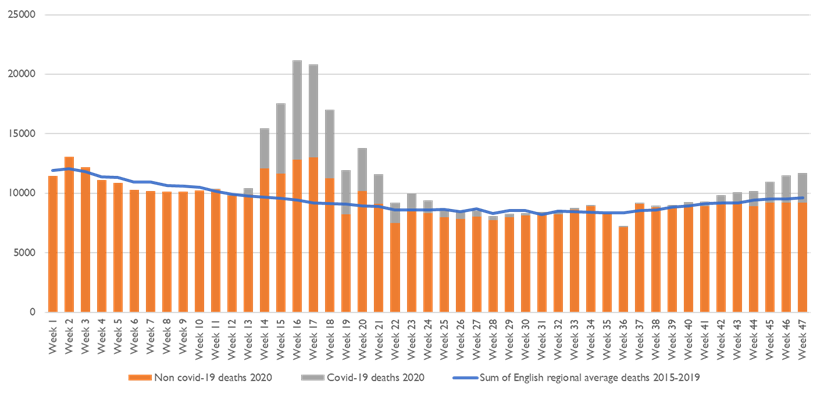
Source: ONS COVID/non-COVID 2020 death data and 2015-2019 death data. Week 47 is the week ending 20 November 2020.