Download the data
Charts
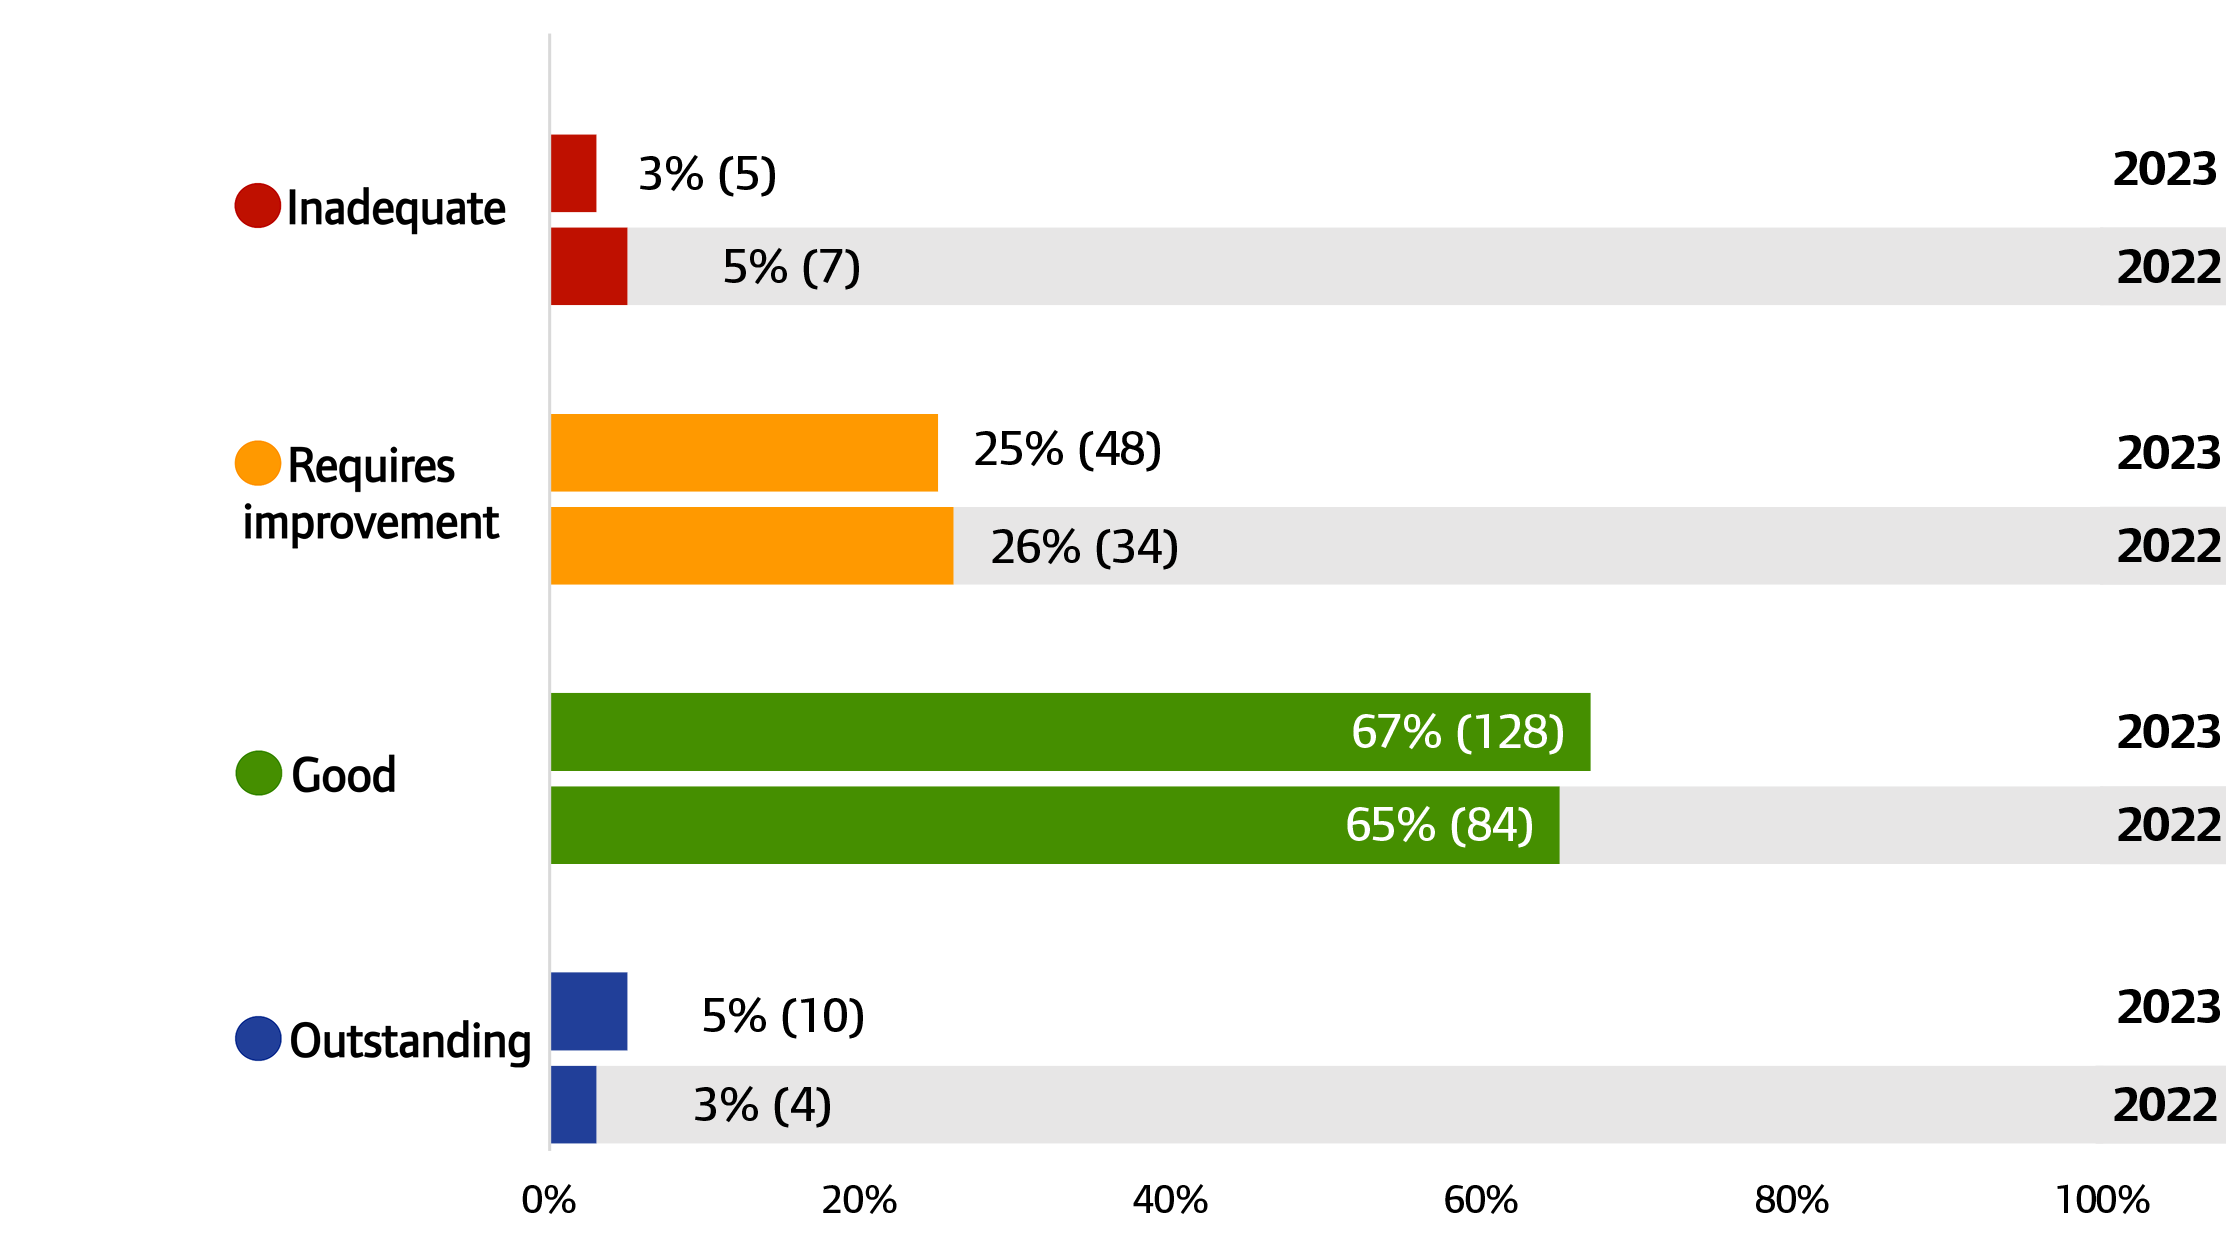
Figure A1: Adult social care, overall ratings, 2022 and 2023
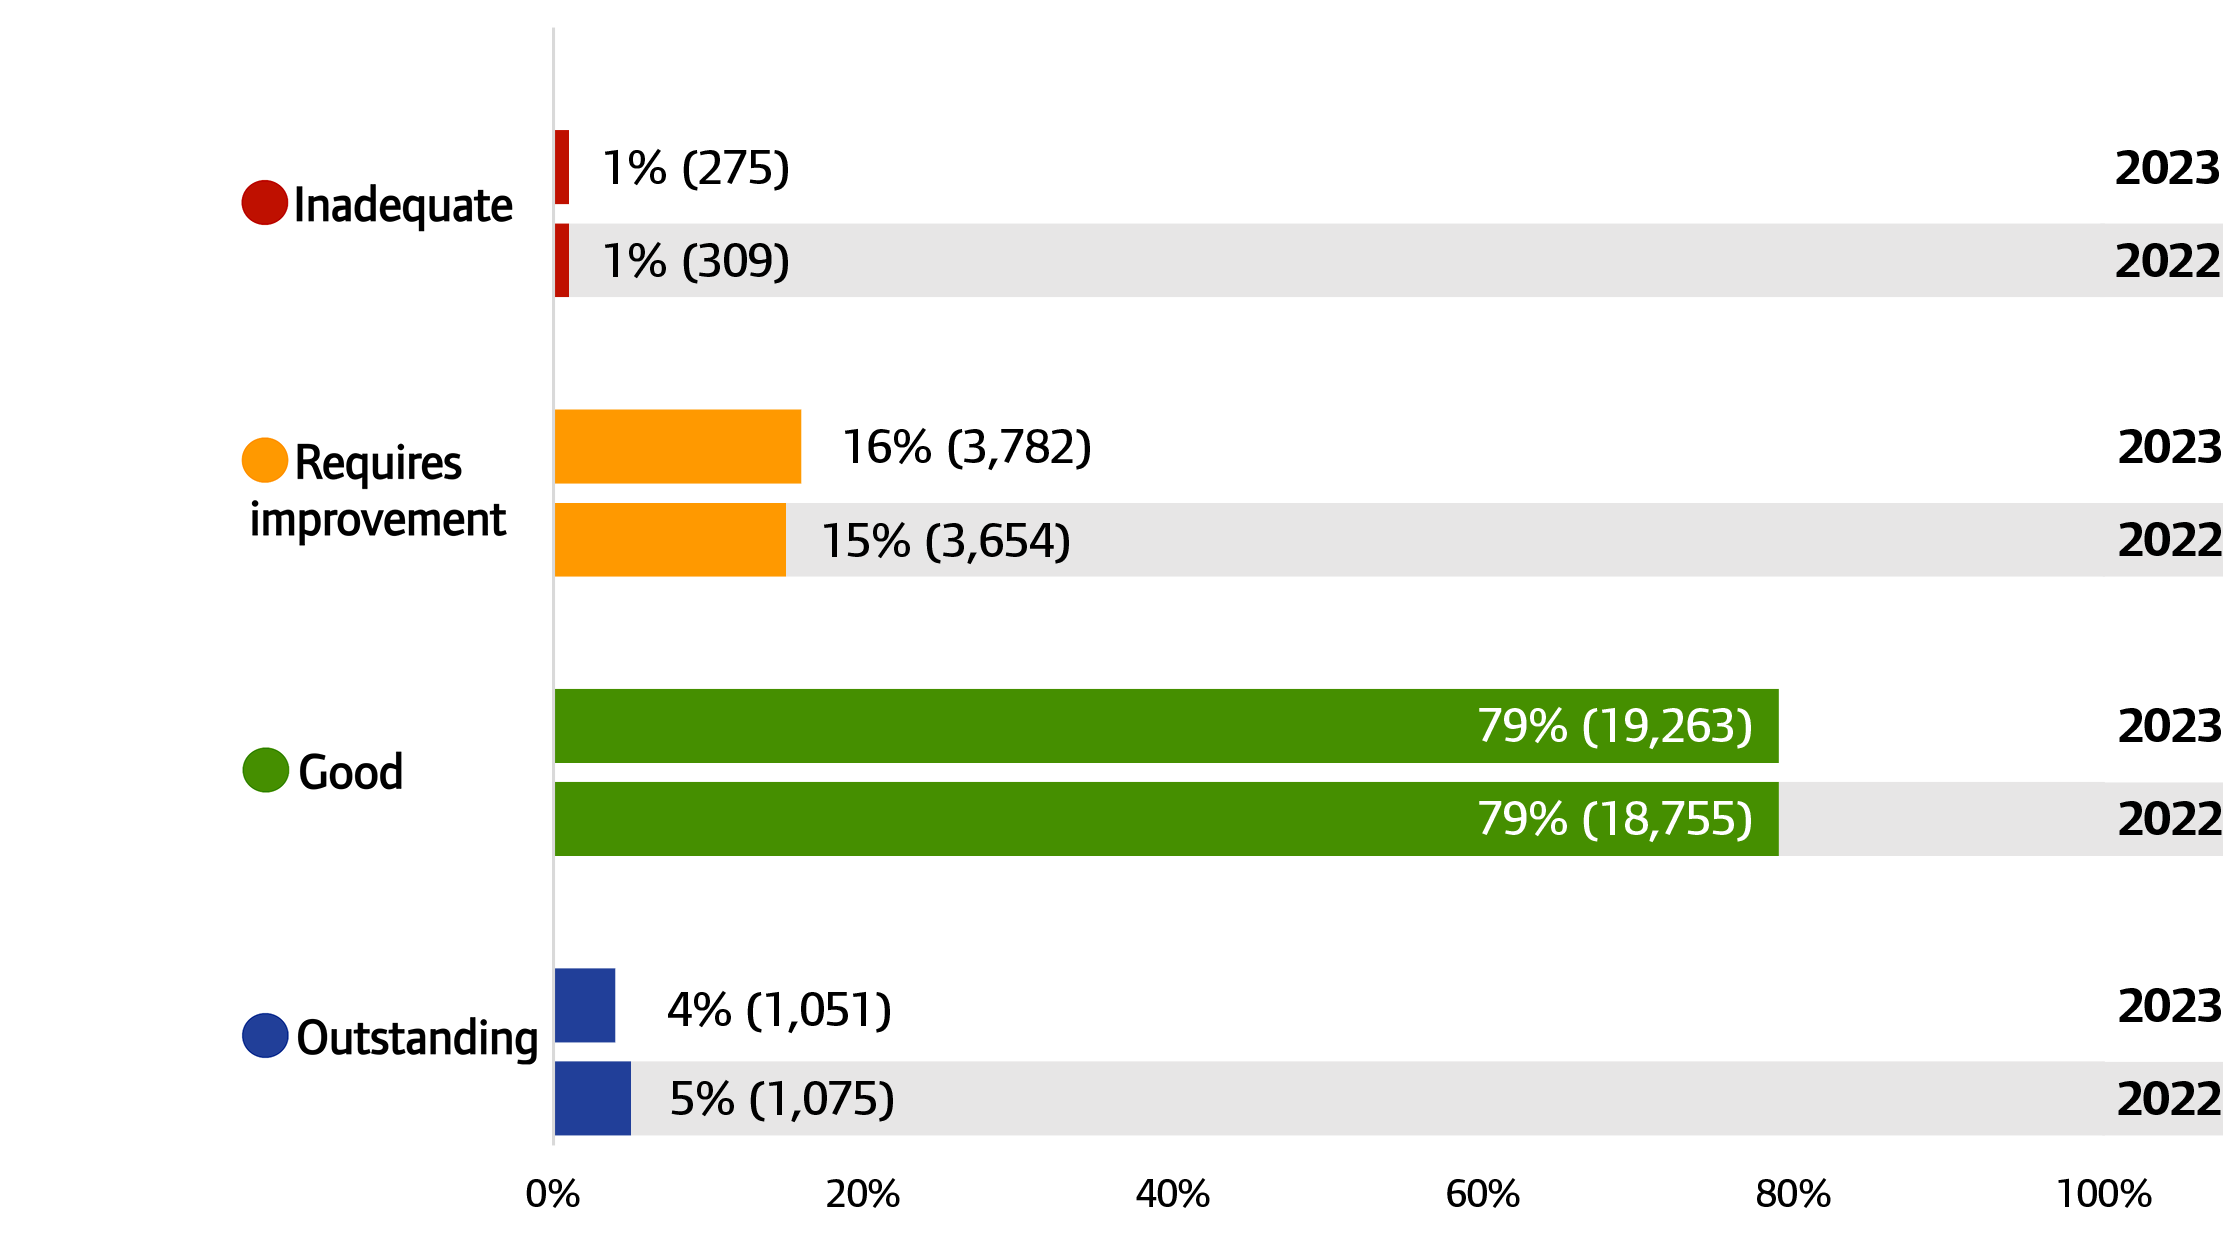
Source: CQC ratings data, 31 July 2022 and 1 August 2023
Note: The 2023 ratings included 18 ‘insufficient evidence to rate’ which represented 0.2% of the total ratings (including ‘insufficient evidence to rate’). Percentages may not add to 100 due to rounding. Percentages between 0.01% and 1% have been rounded up to 1%.
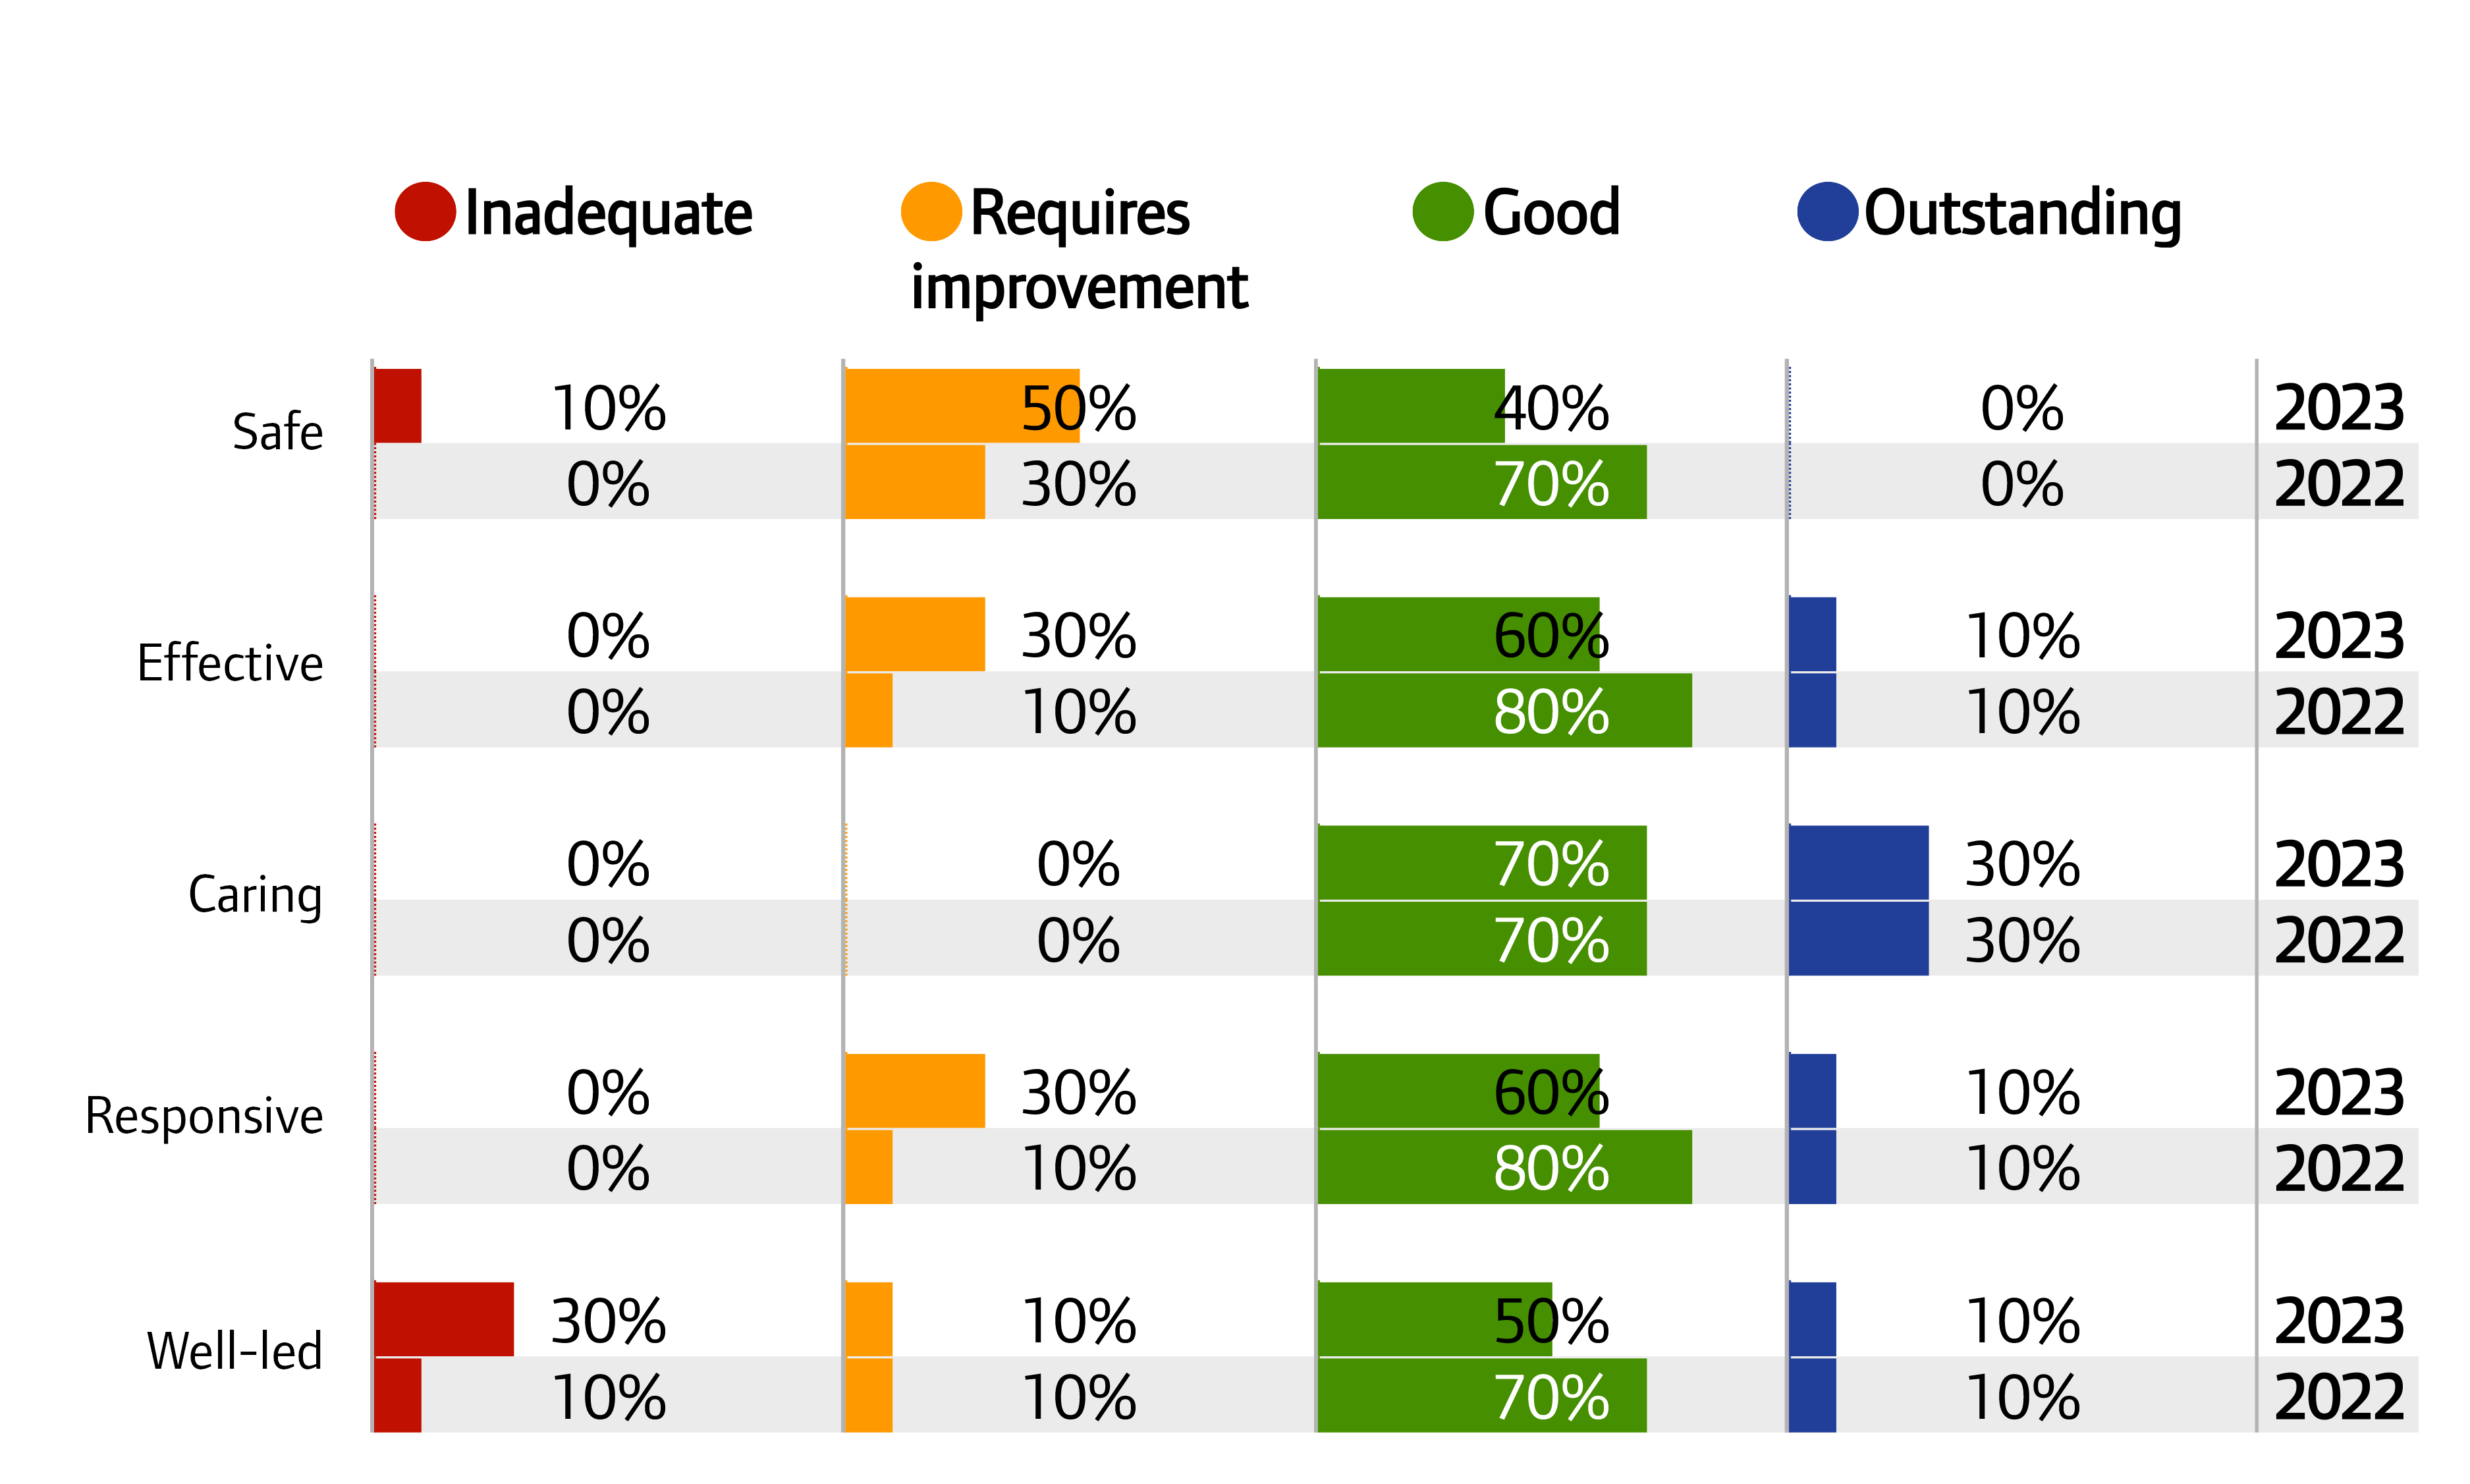
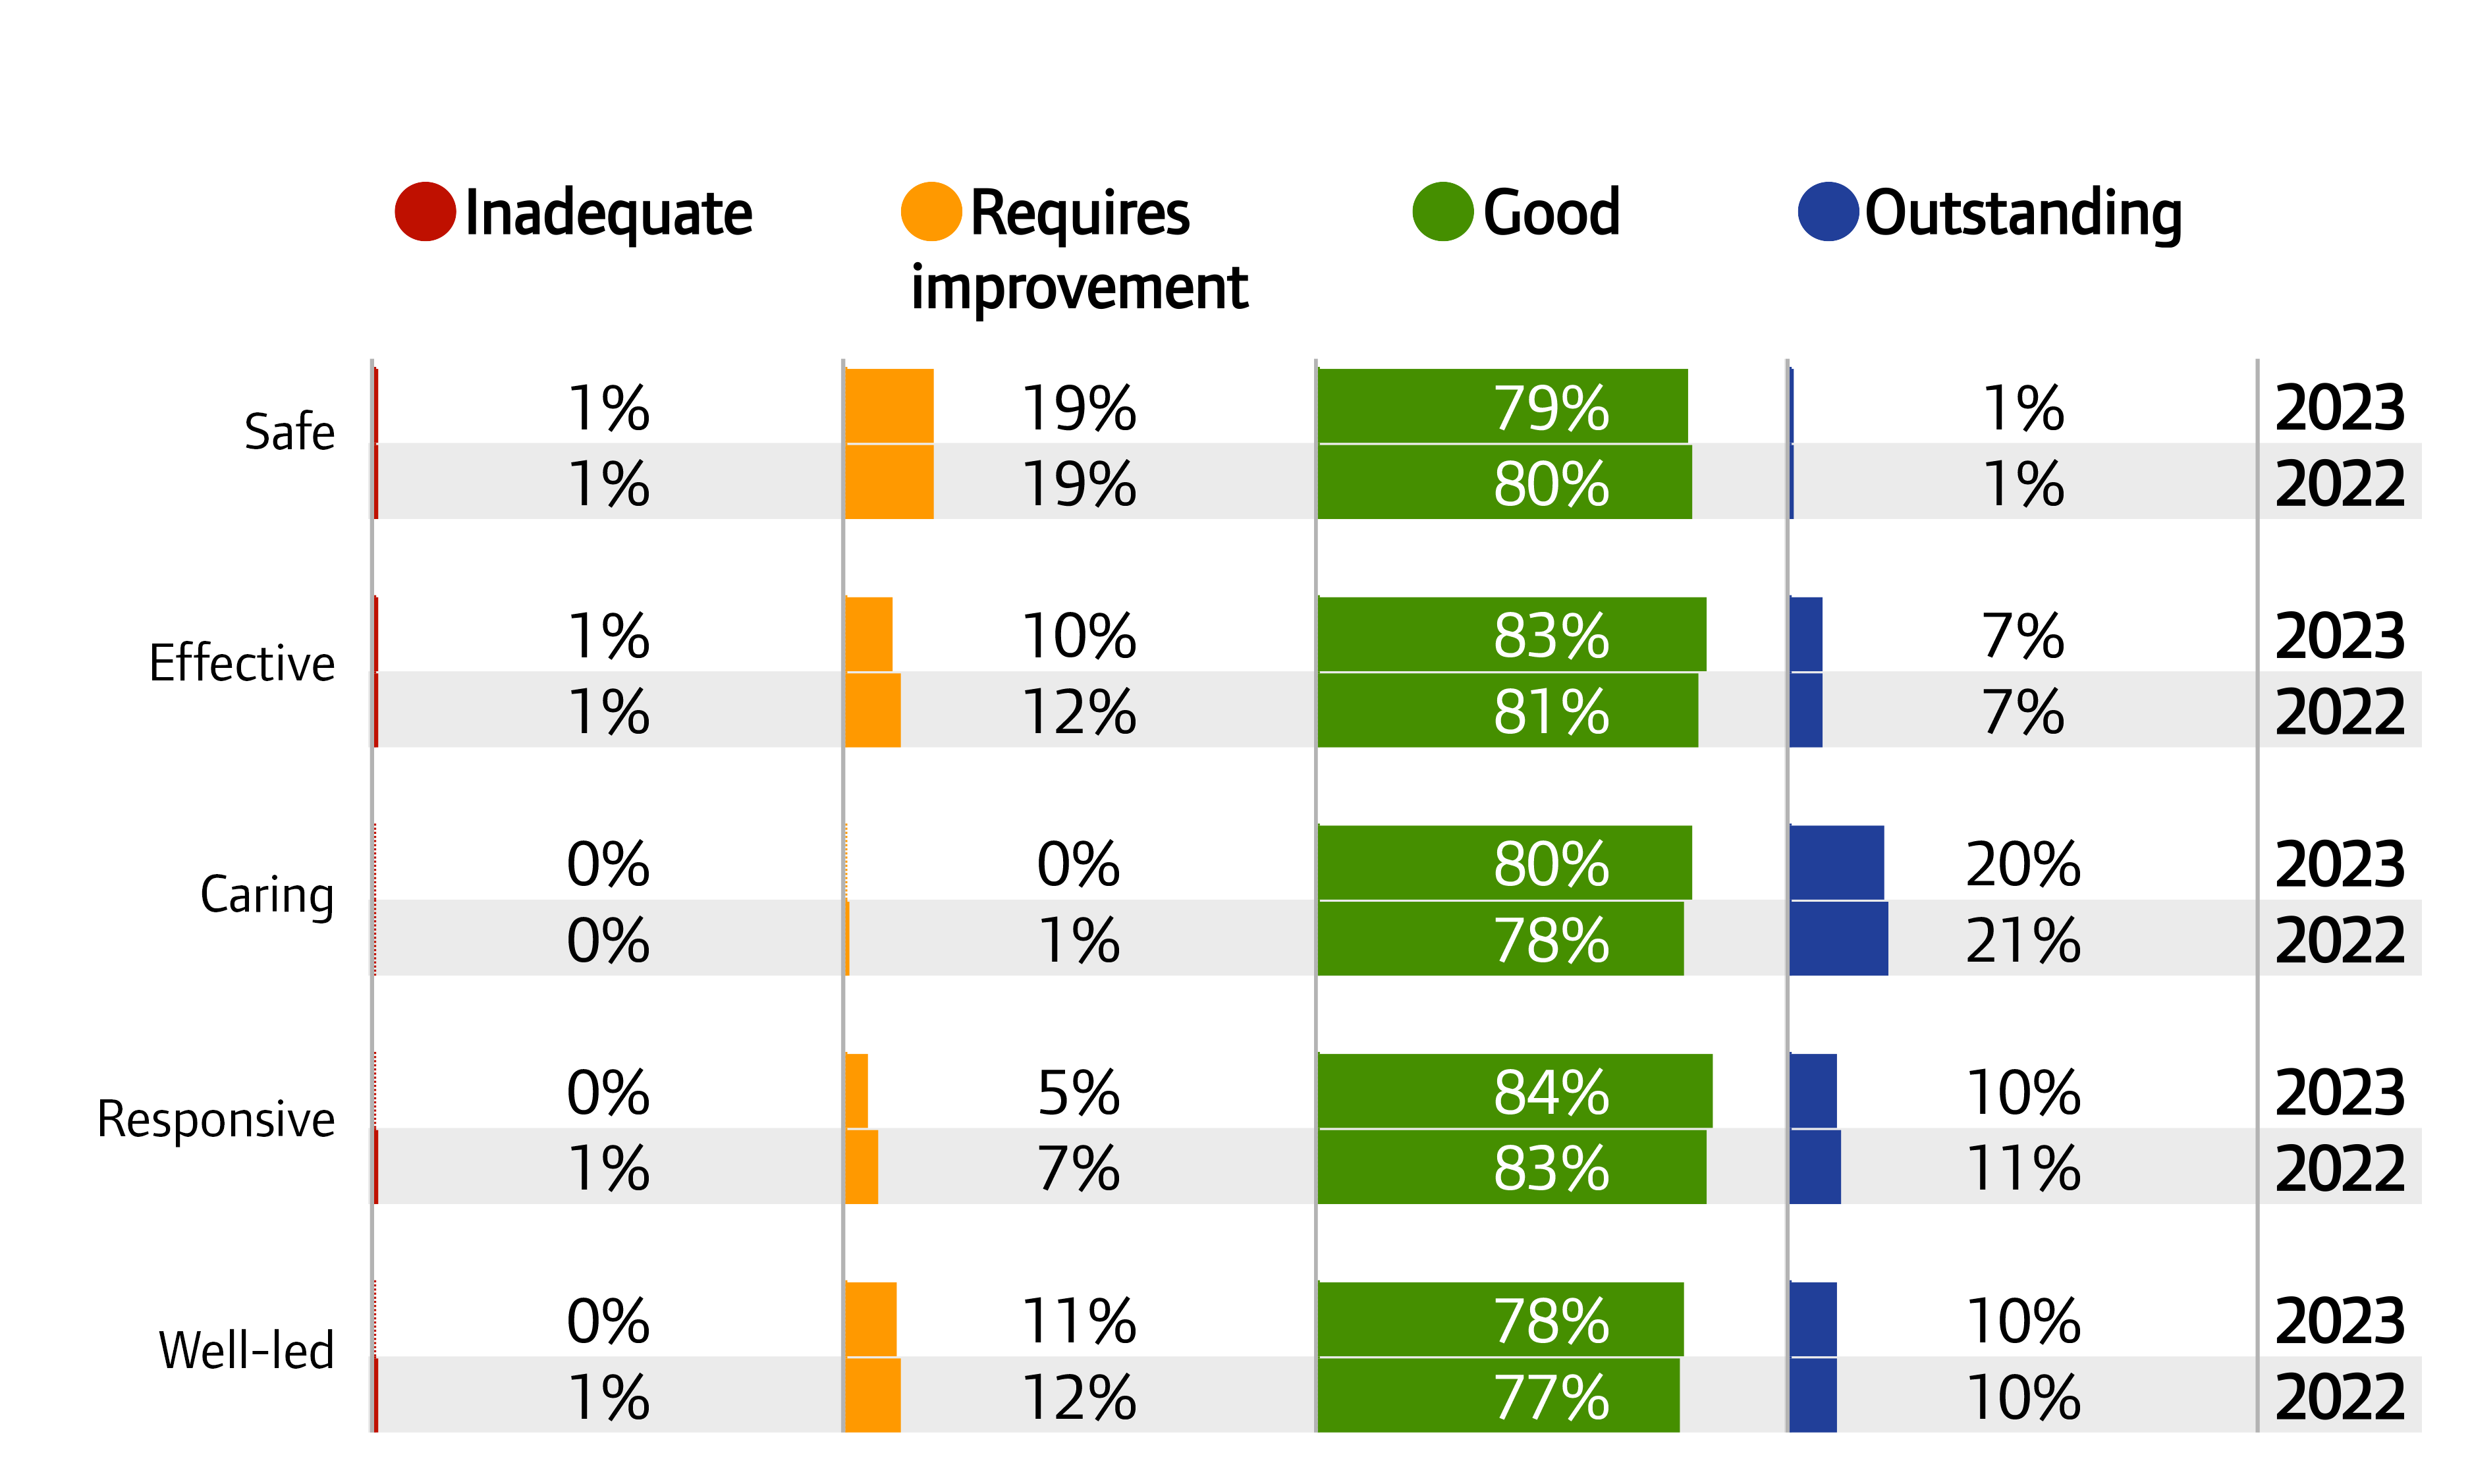
Figure A2: Adult social care, key question ratings, 2022 and 2023
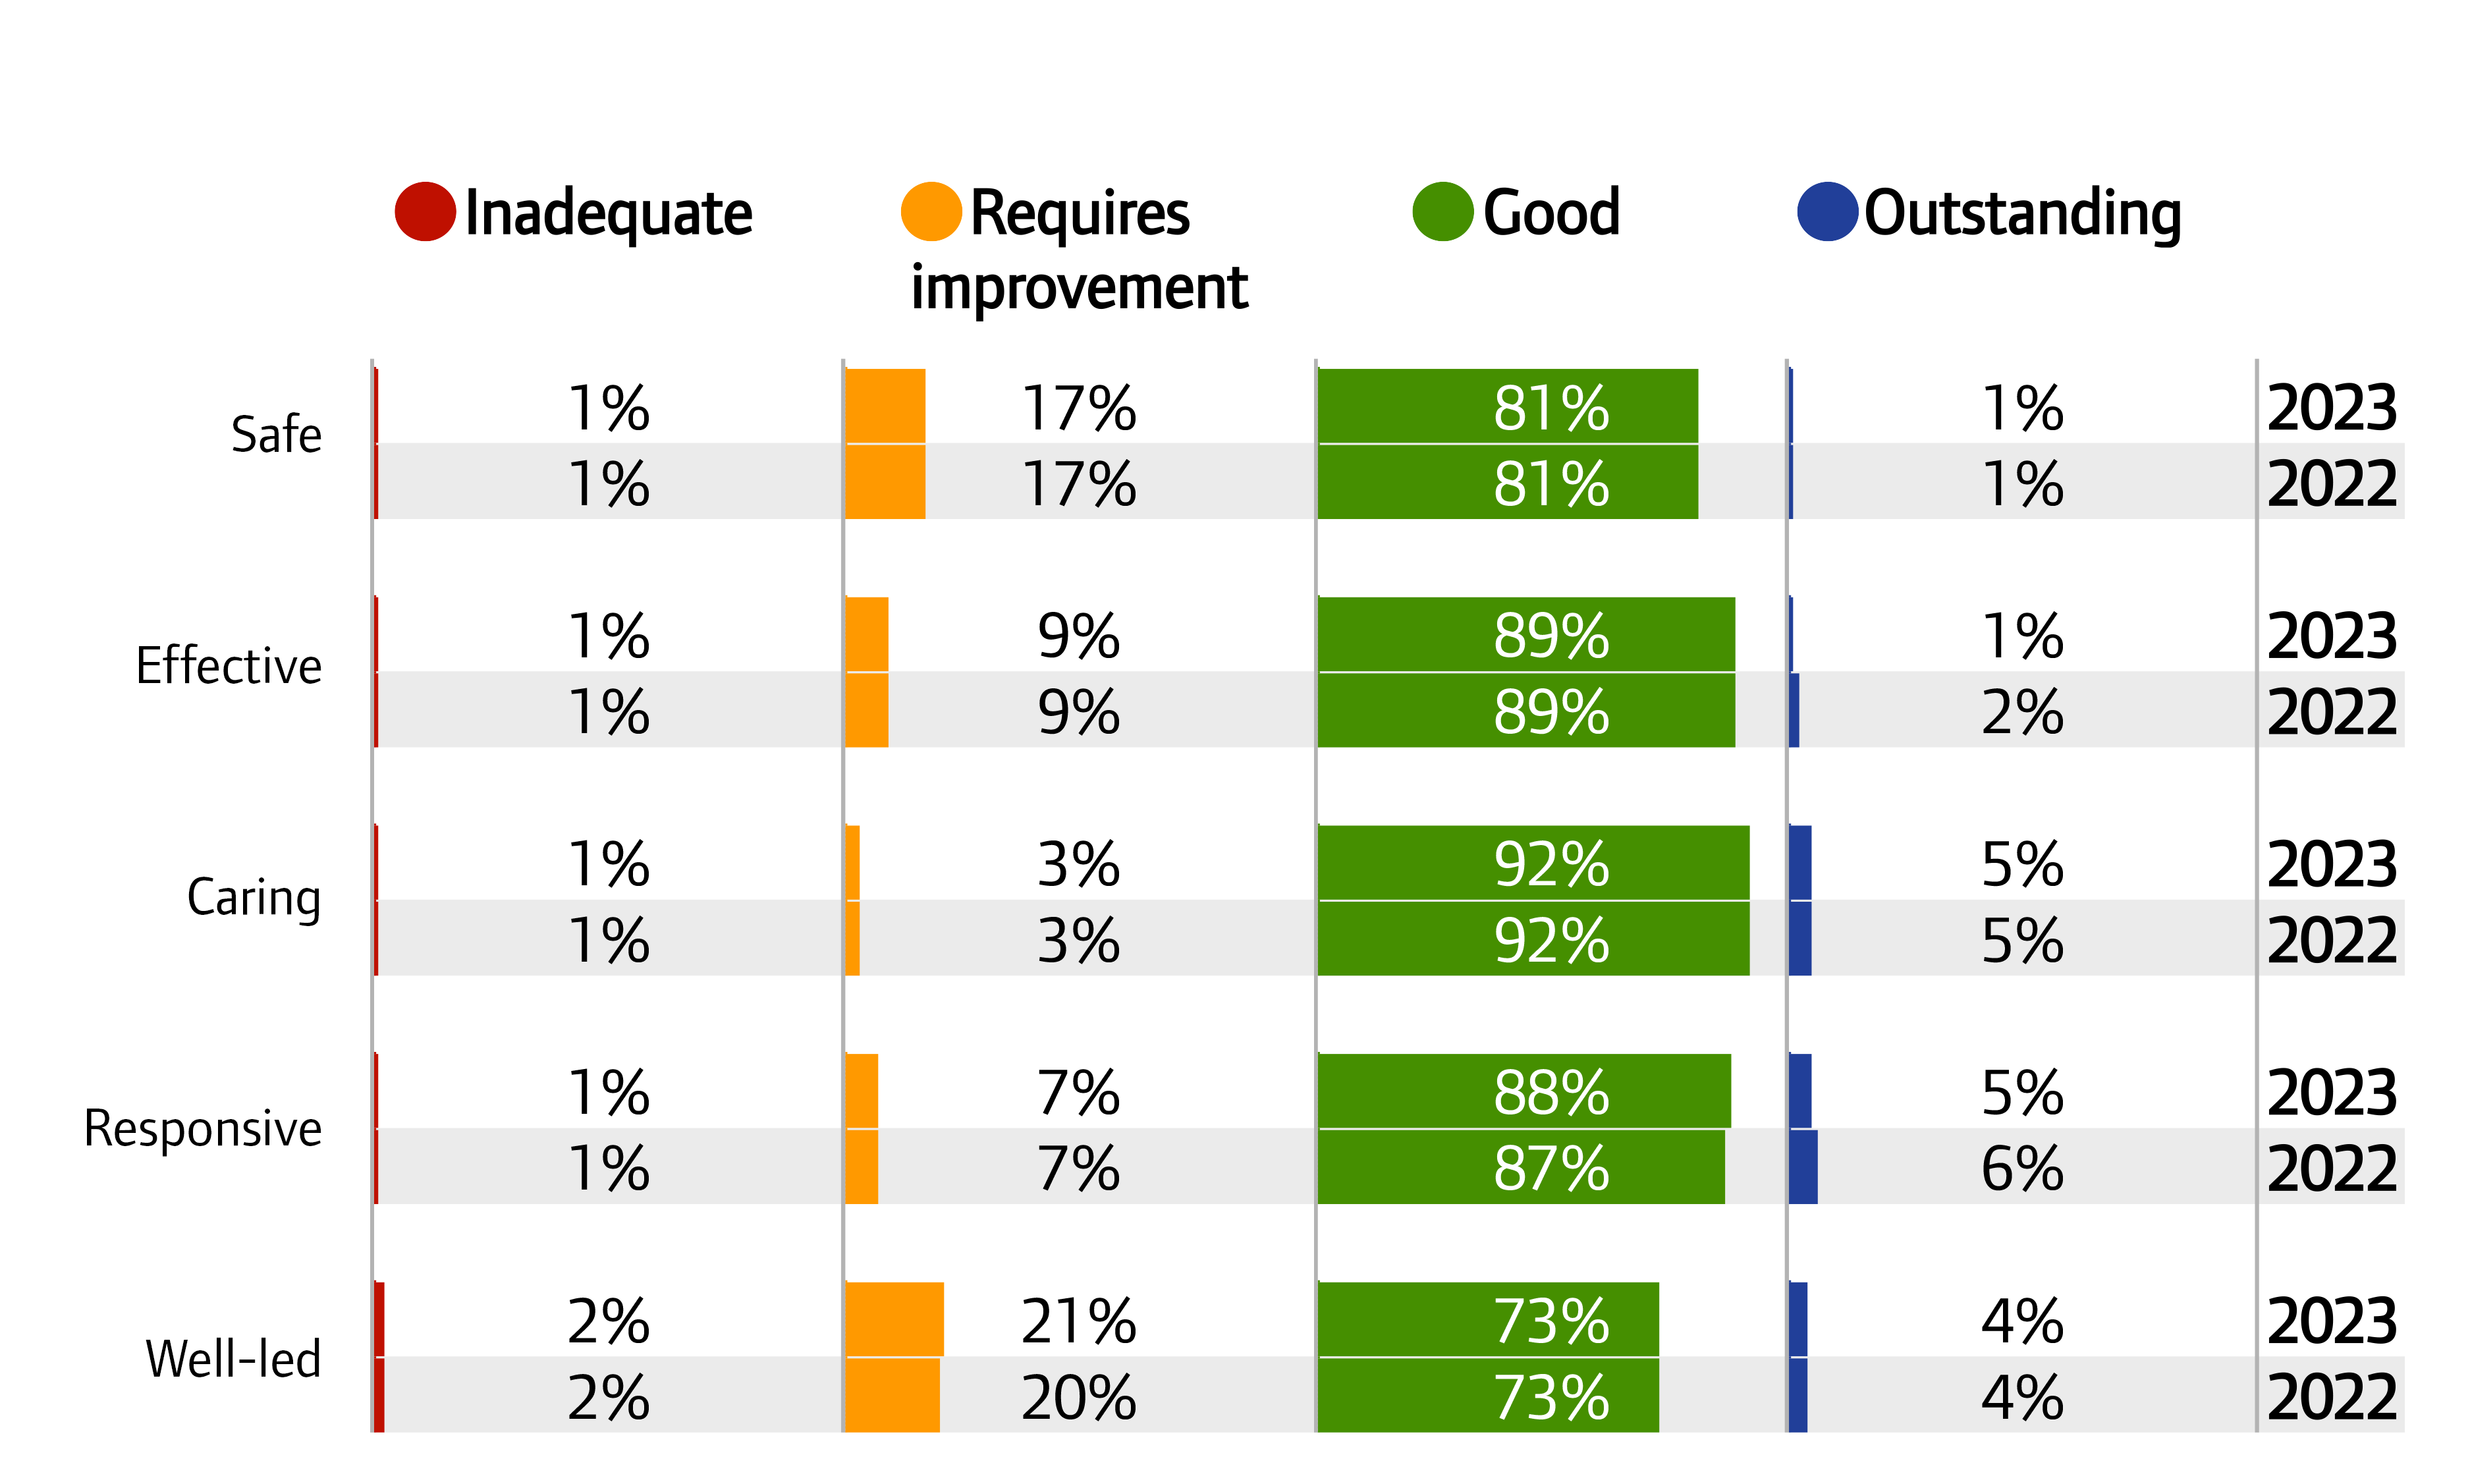
Source: CQC ratings data, 31 July 2022 and 1 August 2023
Note: In 2023, at key question level, ‘insufficient evidence to rate’ ratings represented the following proportions of homecare (domiciliary care agencies – DCA): 0.12% for caring, 0.15% safe and well-led and 0.13% for responsive and 0.14% for effective. Of residential homes: 0.01% for well led and safe, 0.02% for responsive, caring and effective. Of nursing homes: 0.05% for responsive and caring. Percentages may not add to 100 due to rounding. Percentages between 0.01% and 1% have been rounded up to 1%.
Figure A3: Adult social care, overall ratings by service type, 2022 and 2023
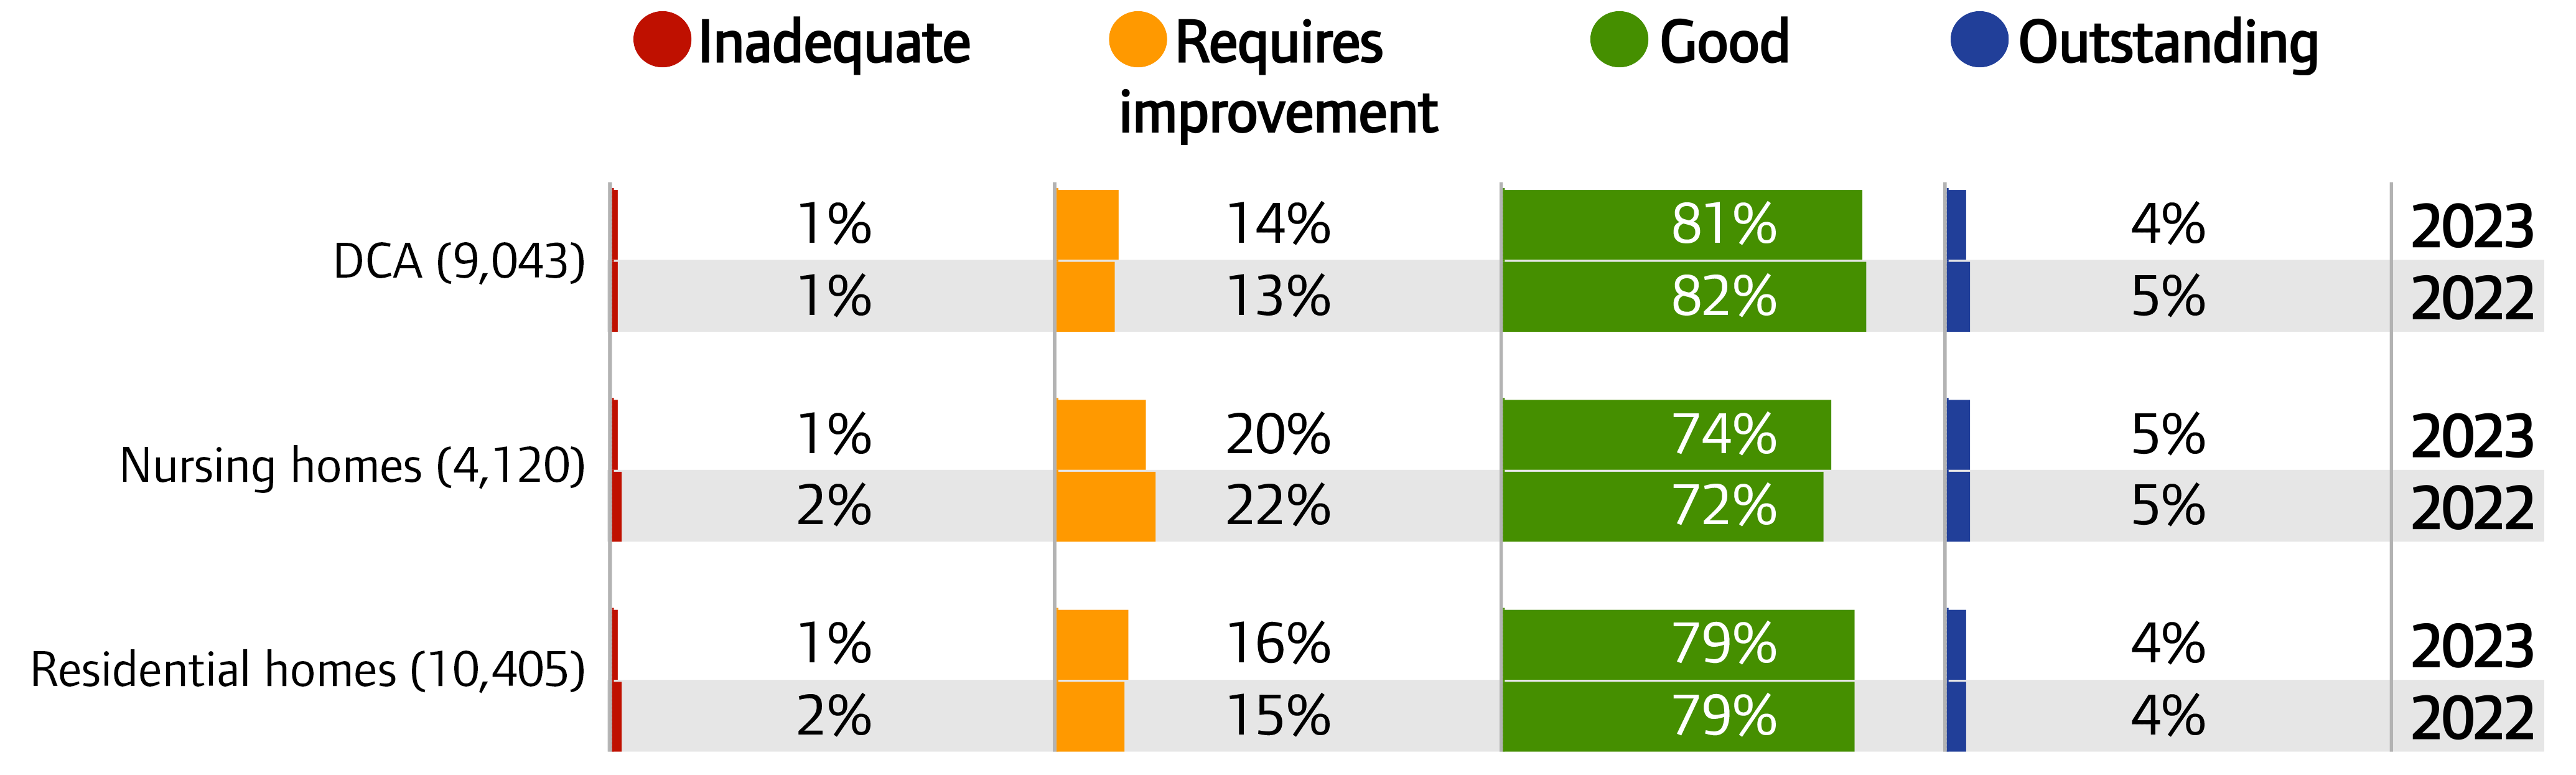
Source: CQC ratings data, 31 July 2022 and 1 August 2023
Note: The 2023 ratings included 17 home care (domiciliary care agencies – DCA) ‘insufficient evidence to rate’ and 1 residential homes ‘insufficient evidence to rate’ rating. This represented 0.19% and 0.01% of the total ratings respectively (including ‘insufficient evidence to rate’). Percentages may not add to 100 due to rounding. Percentages between 0.01% and 1% have been rounded up to 1%.
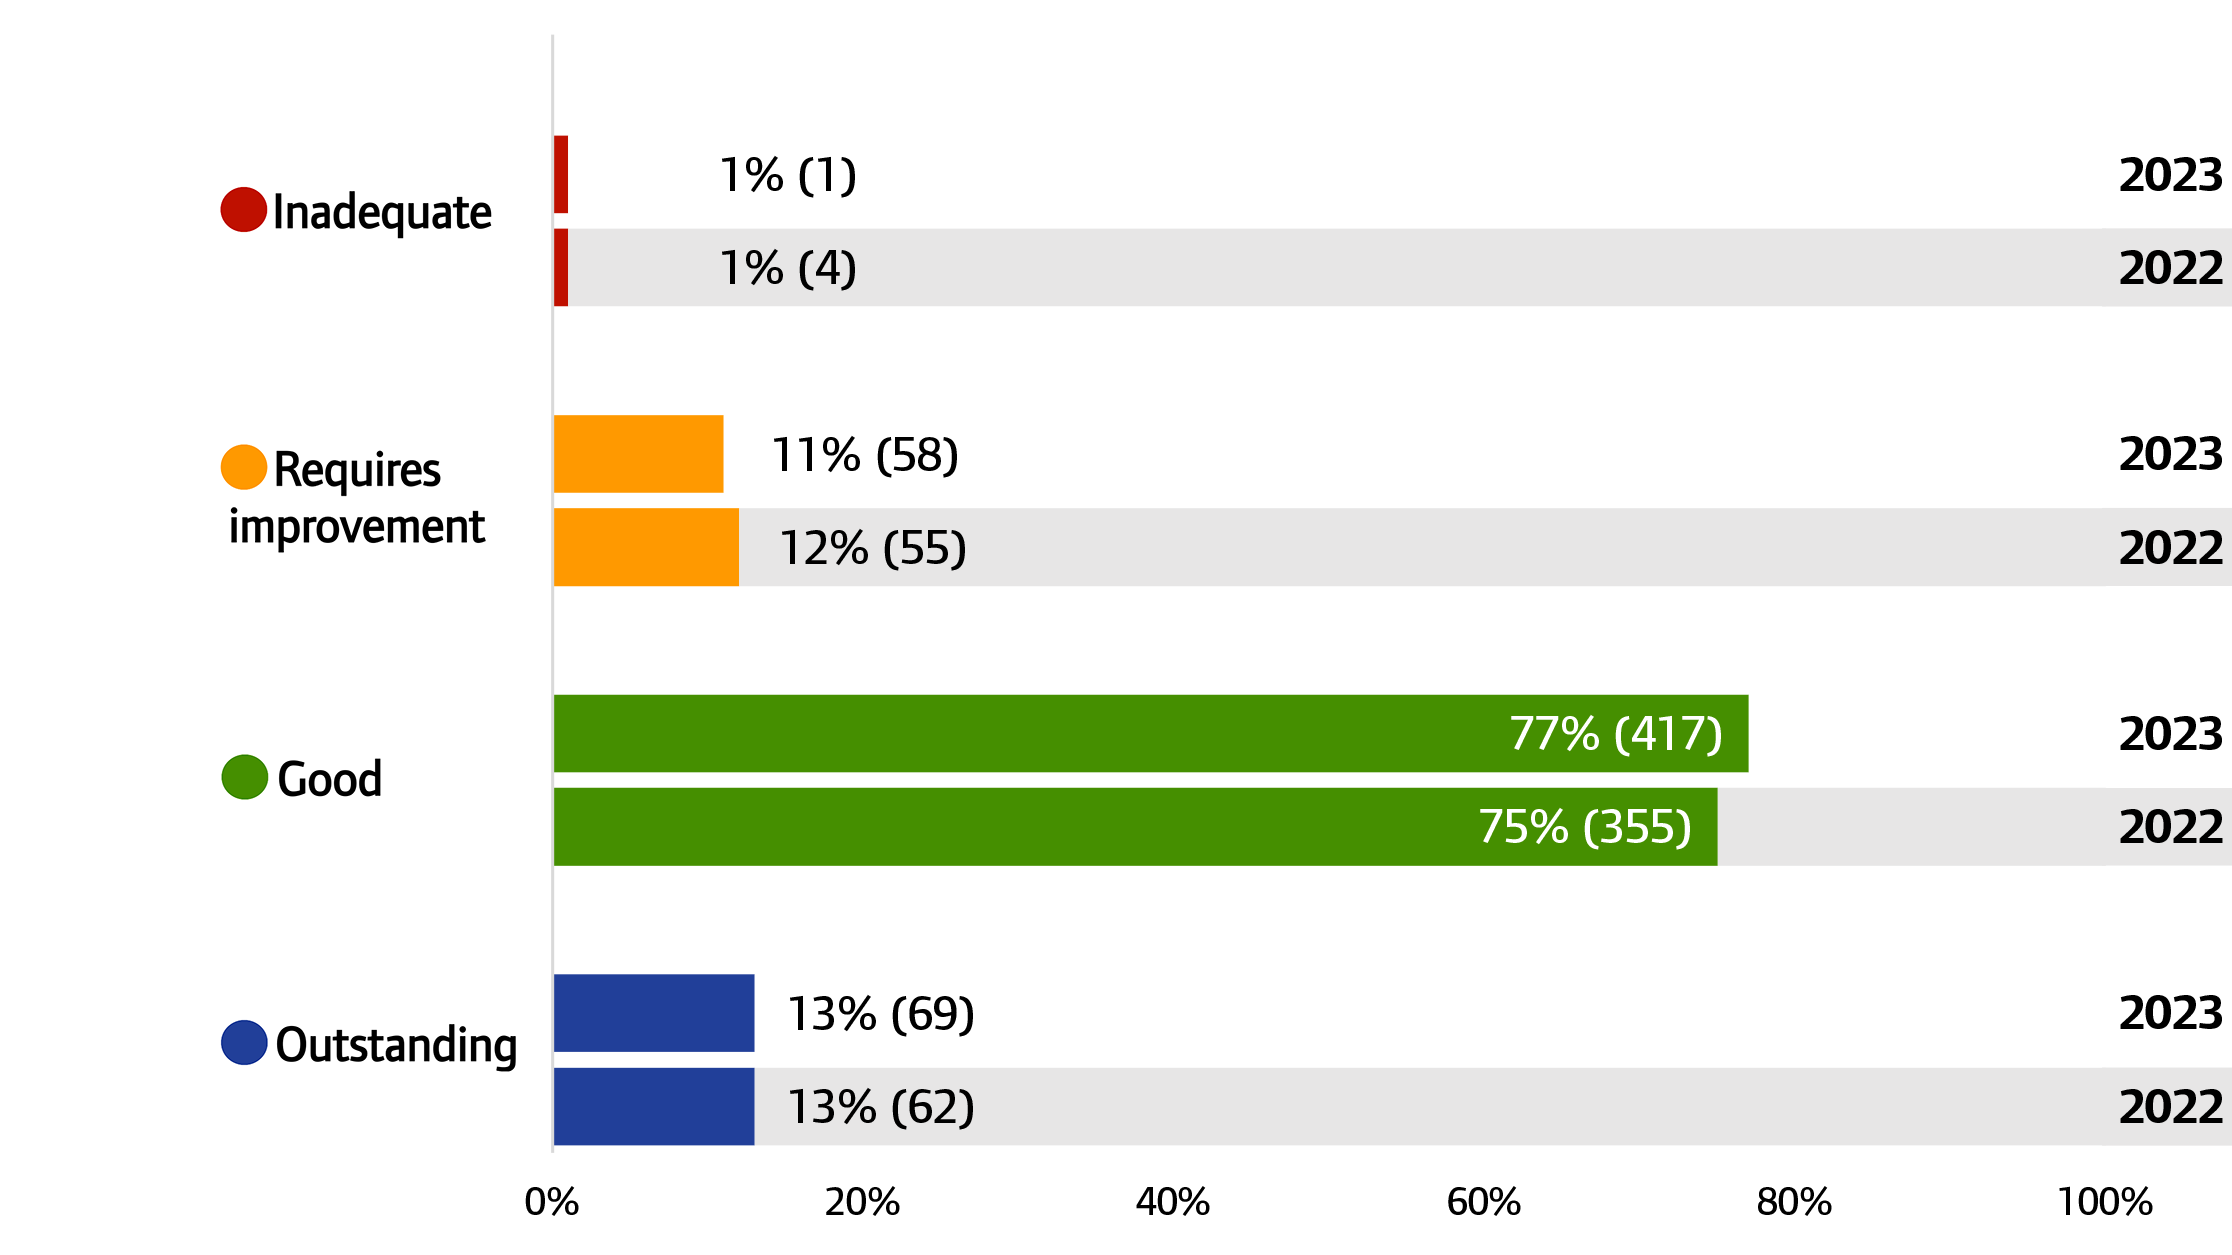
Figure A4: GP practices, overall ratings, 2022 and 2023
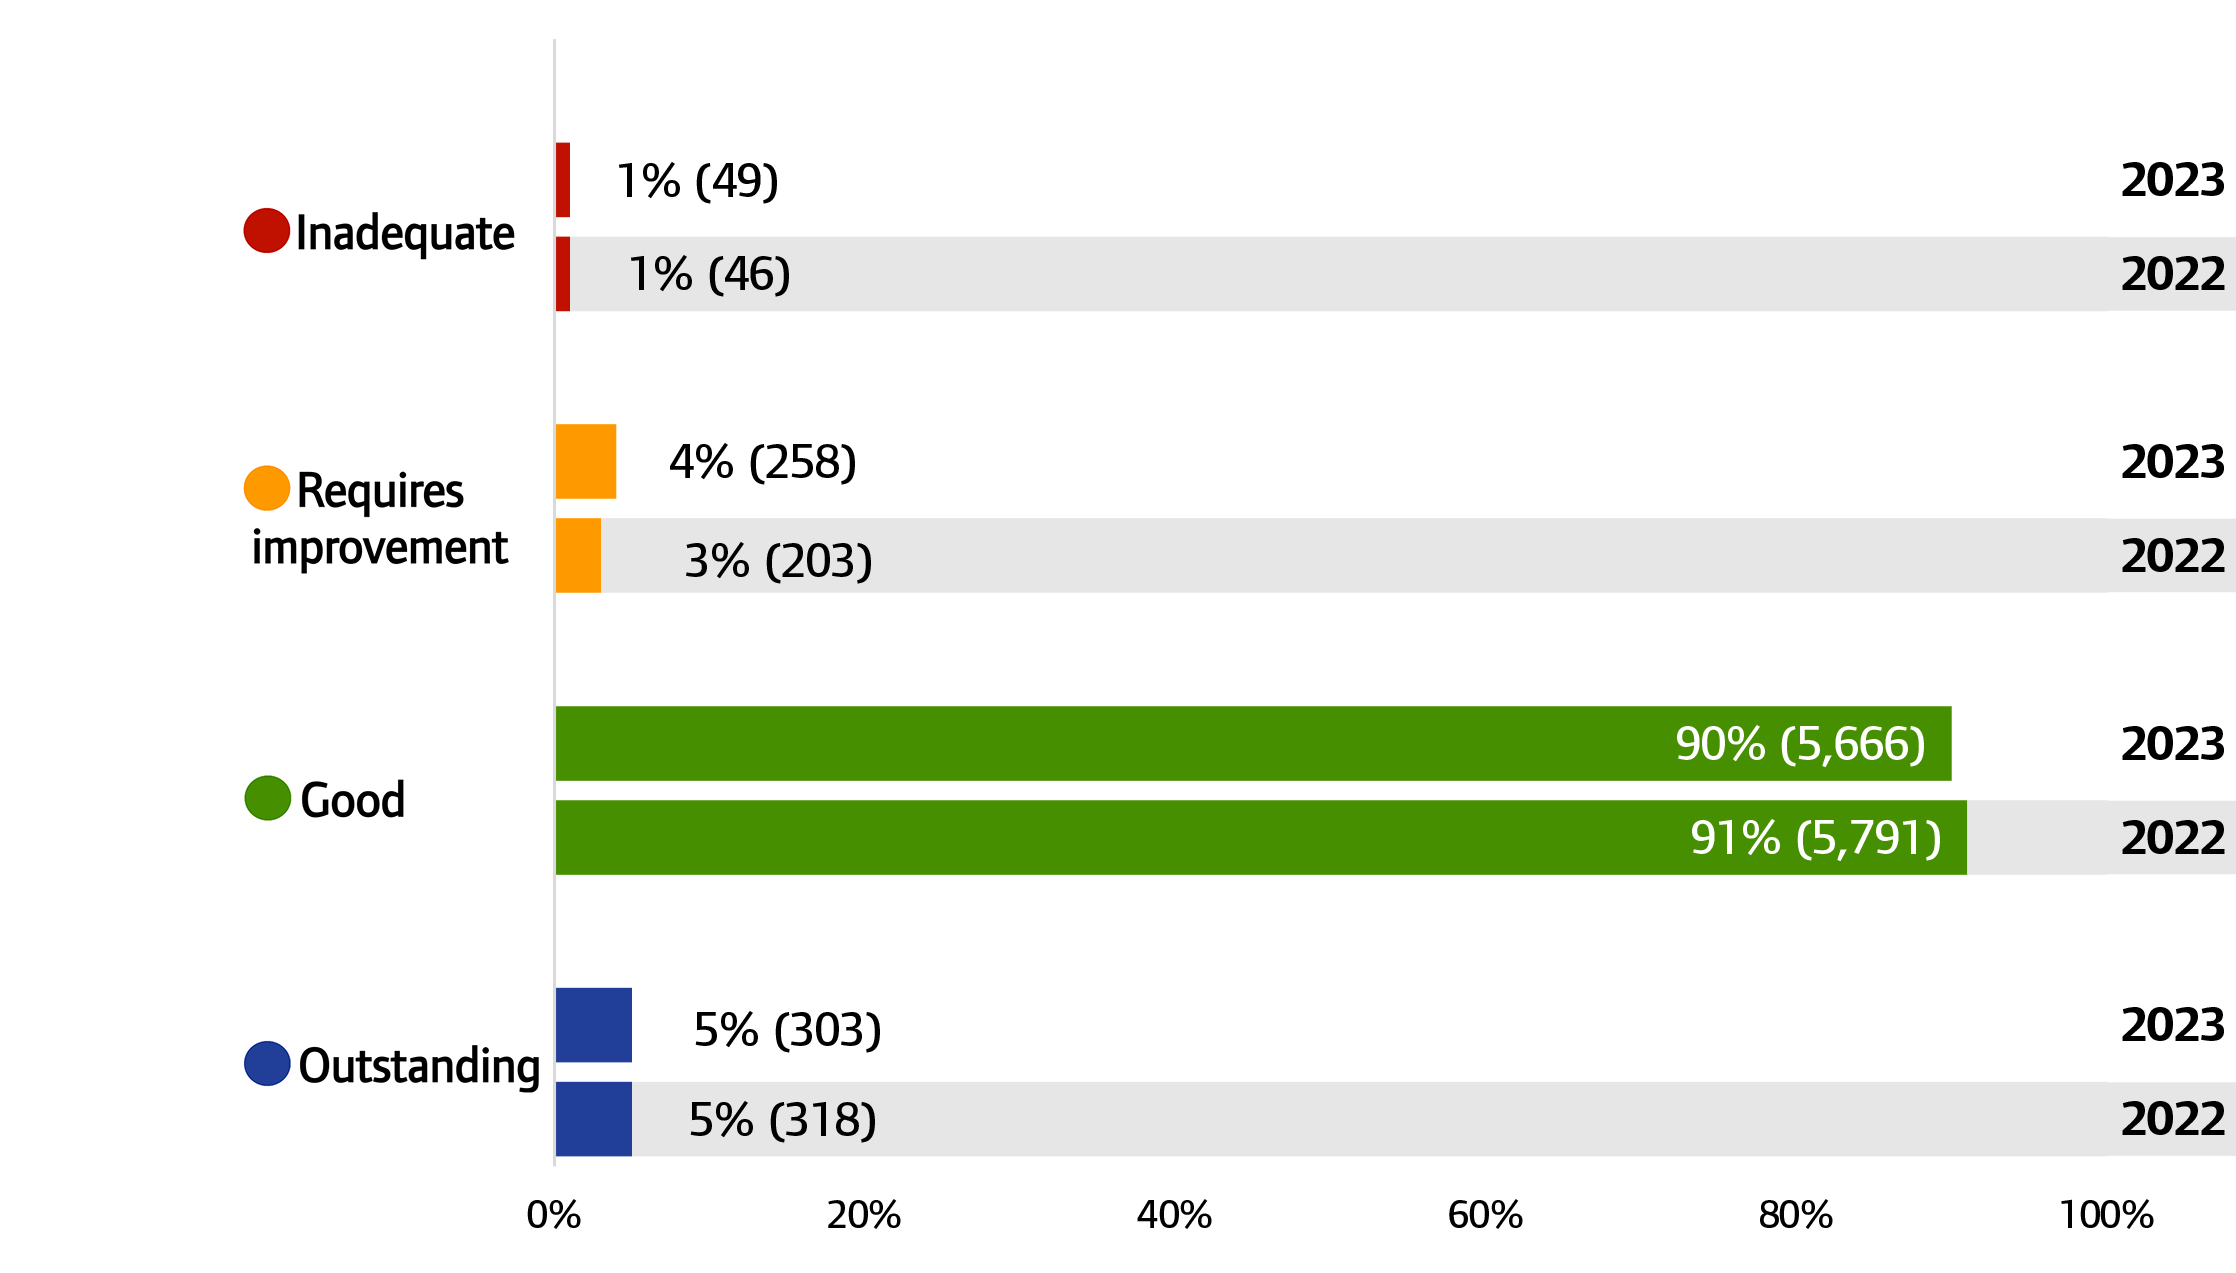
Source: CQC ratings data, 31 July 2022 and 1 August 2023
Note: Percentages may not add to 100 due to rounding. Percentages between 0.01% and 1% have been rounded up to 1%.
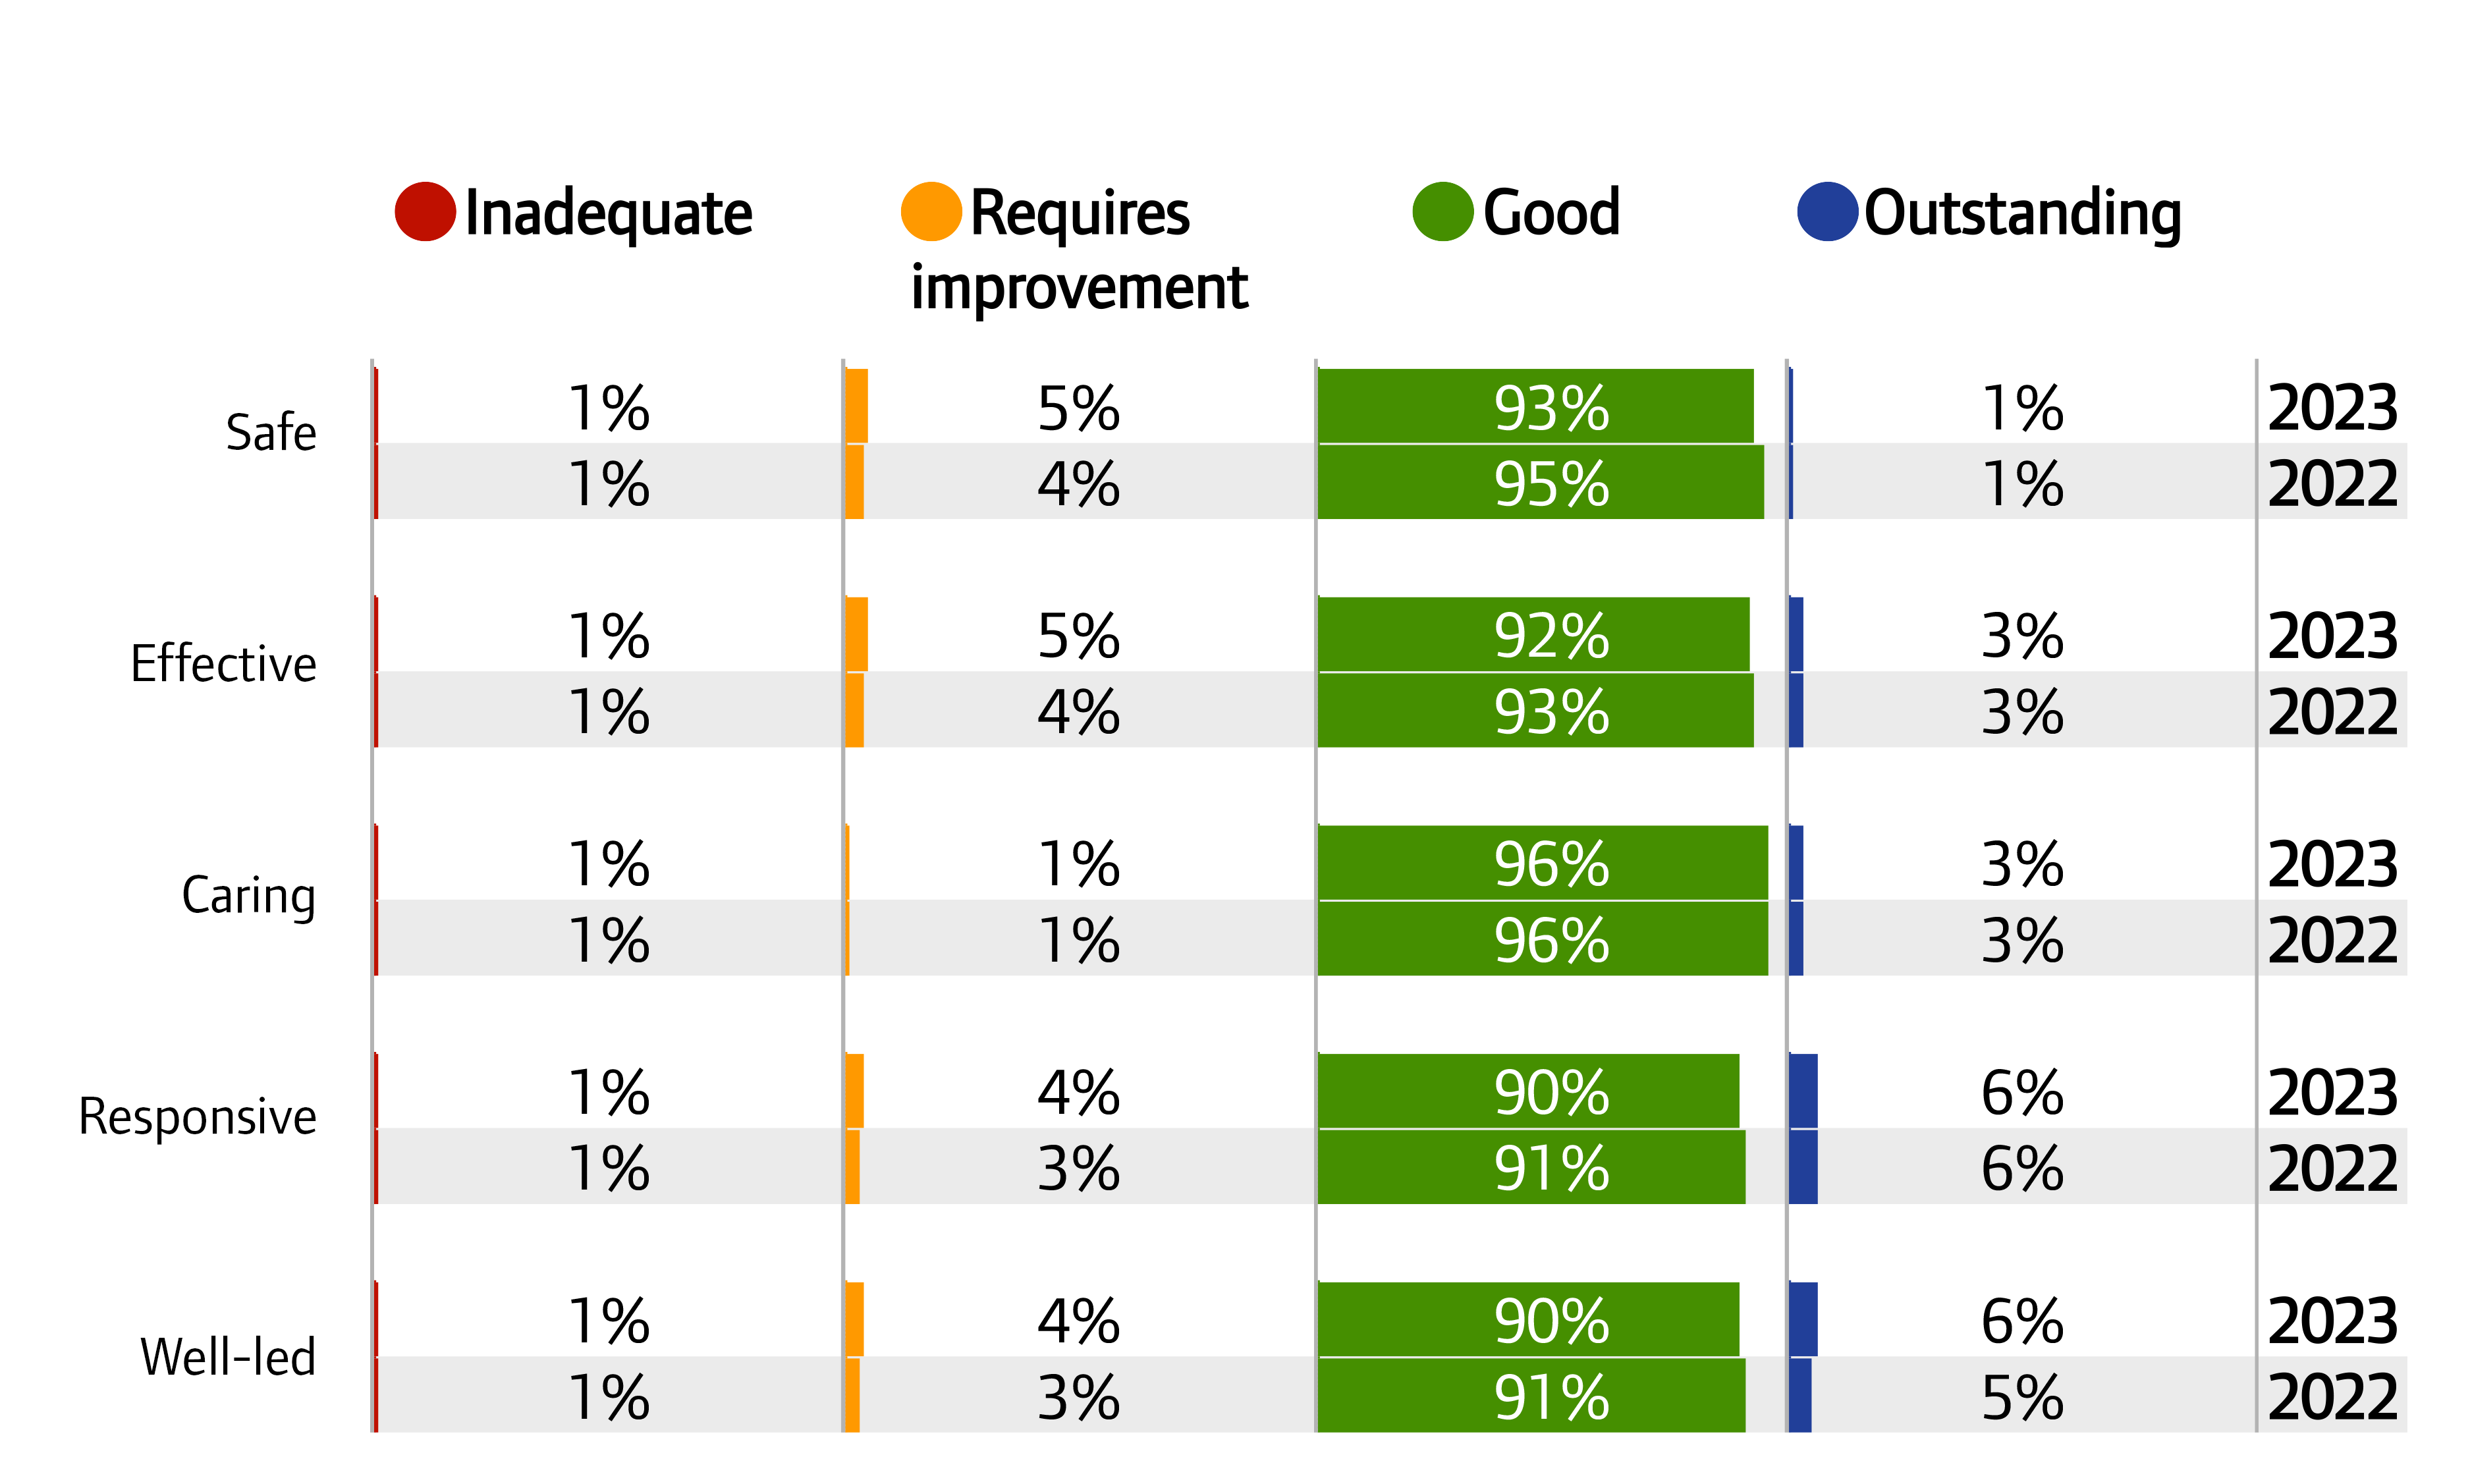
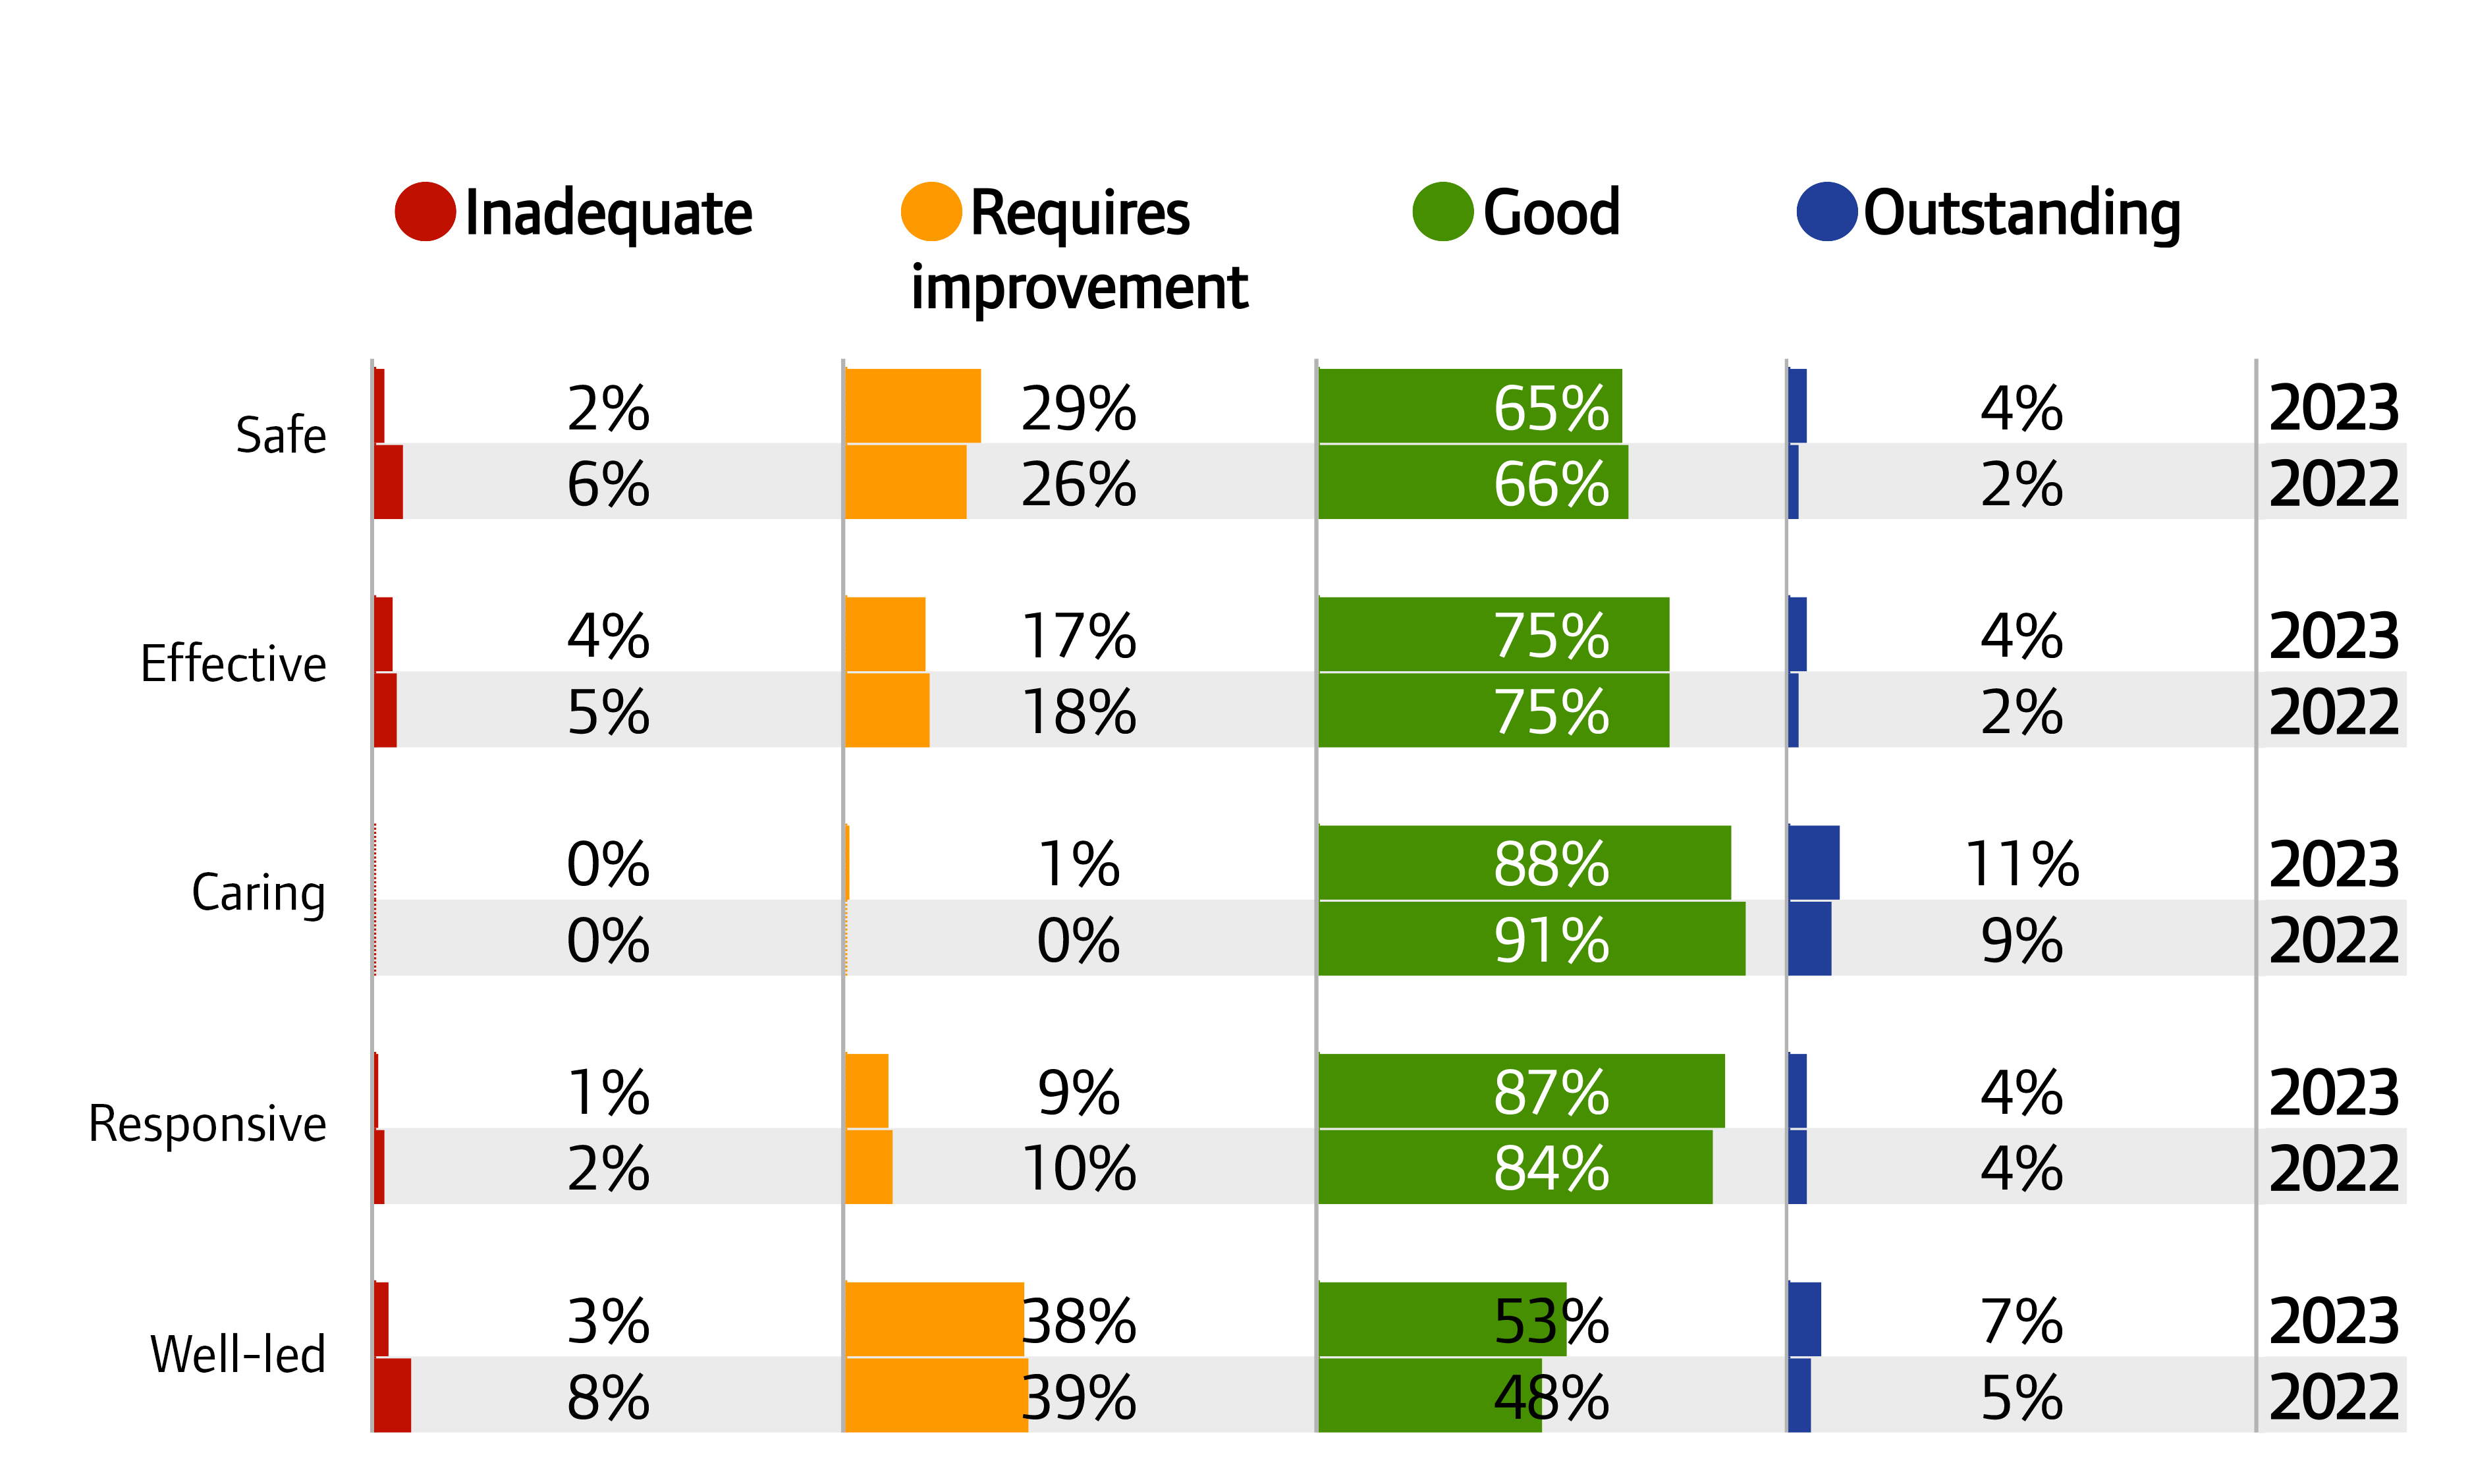
Figure A5: GP practices, key question ratings, 2022 and 2023
Source: CQC ratings data, 31 July 2022 and 1 August 2023
Note: At key question level for the 2023 ratings ‘insufficient evidence to rate’ ratings represented the following proportions of the total (including ‘insufficient evidence to rate’): 0.016% for safe, and 0.03% for effective, caring and responsive. Percentages may not add to 100 due to rounding. Percentages between 0.01% and 1% have been rounded up to 1%.
Figure A6: Other primary medical services, overall ratings, 2022 and 2023
Source: CQC ratings data, 31 July 2022 and 1 August 2023
Note: Percentages may not add to 100 due to rounding. Percentages between 0.01% and 1% have been rounded up to 1%.
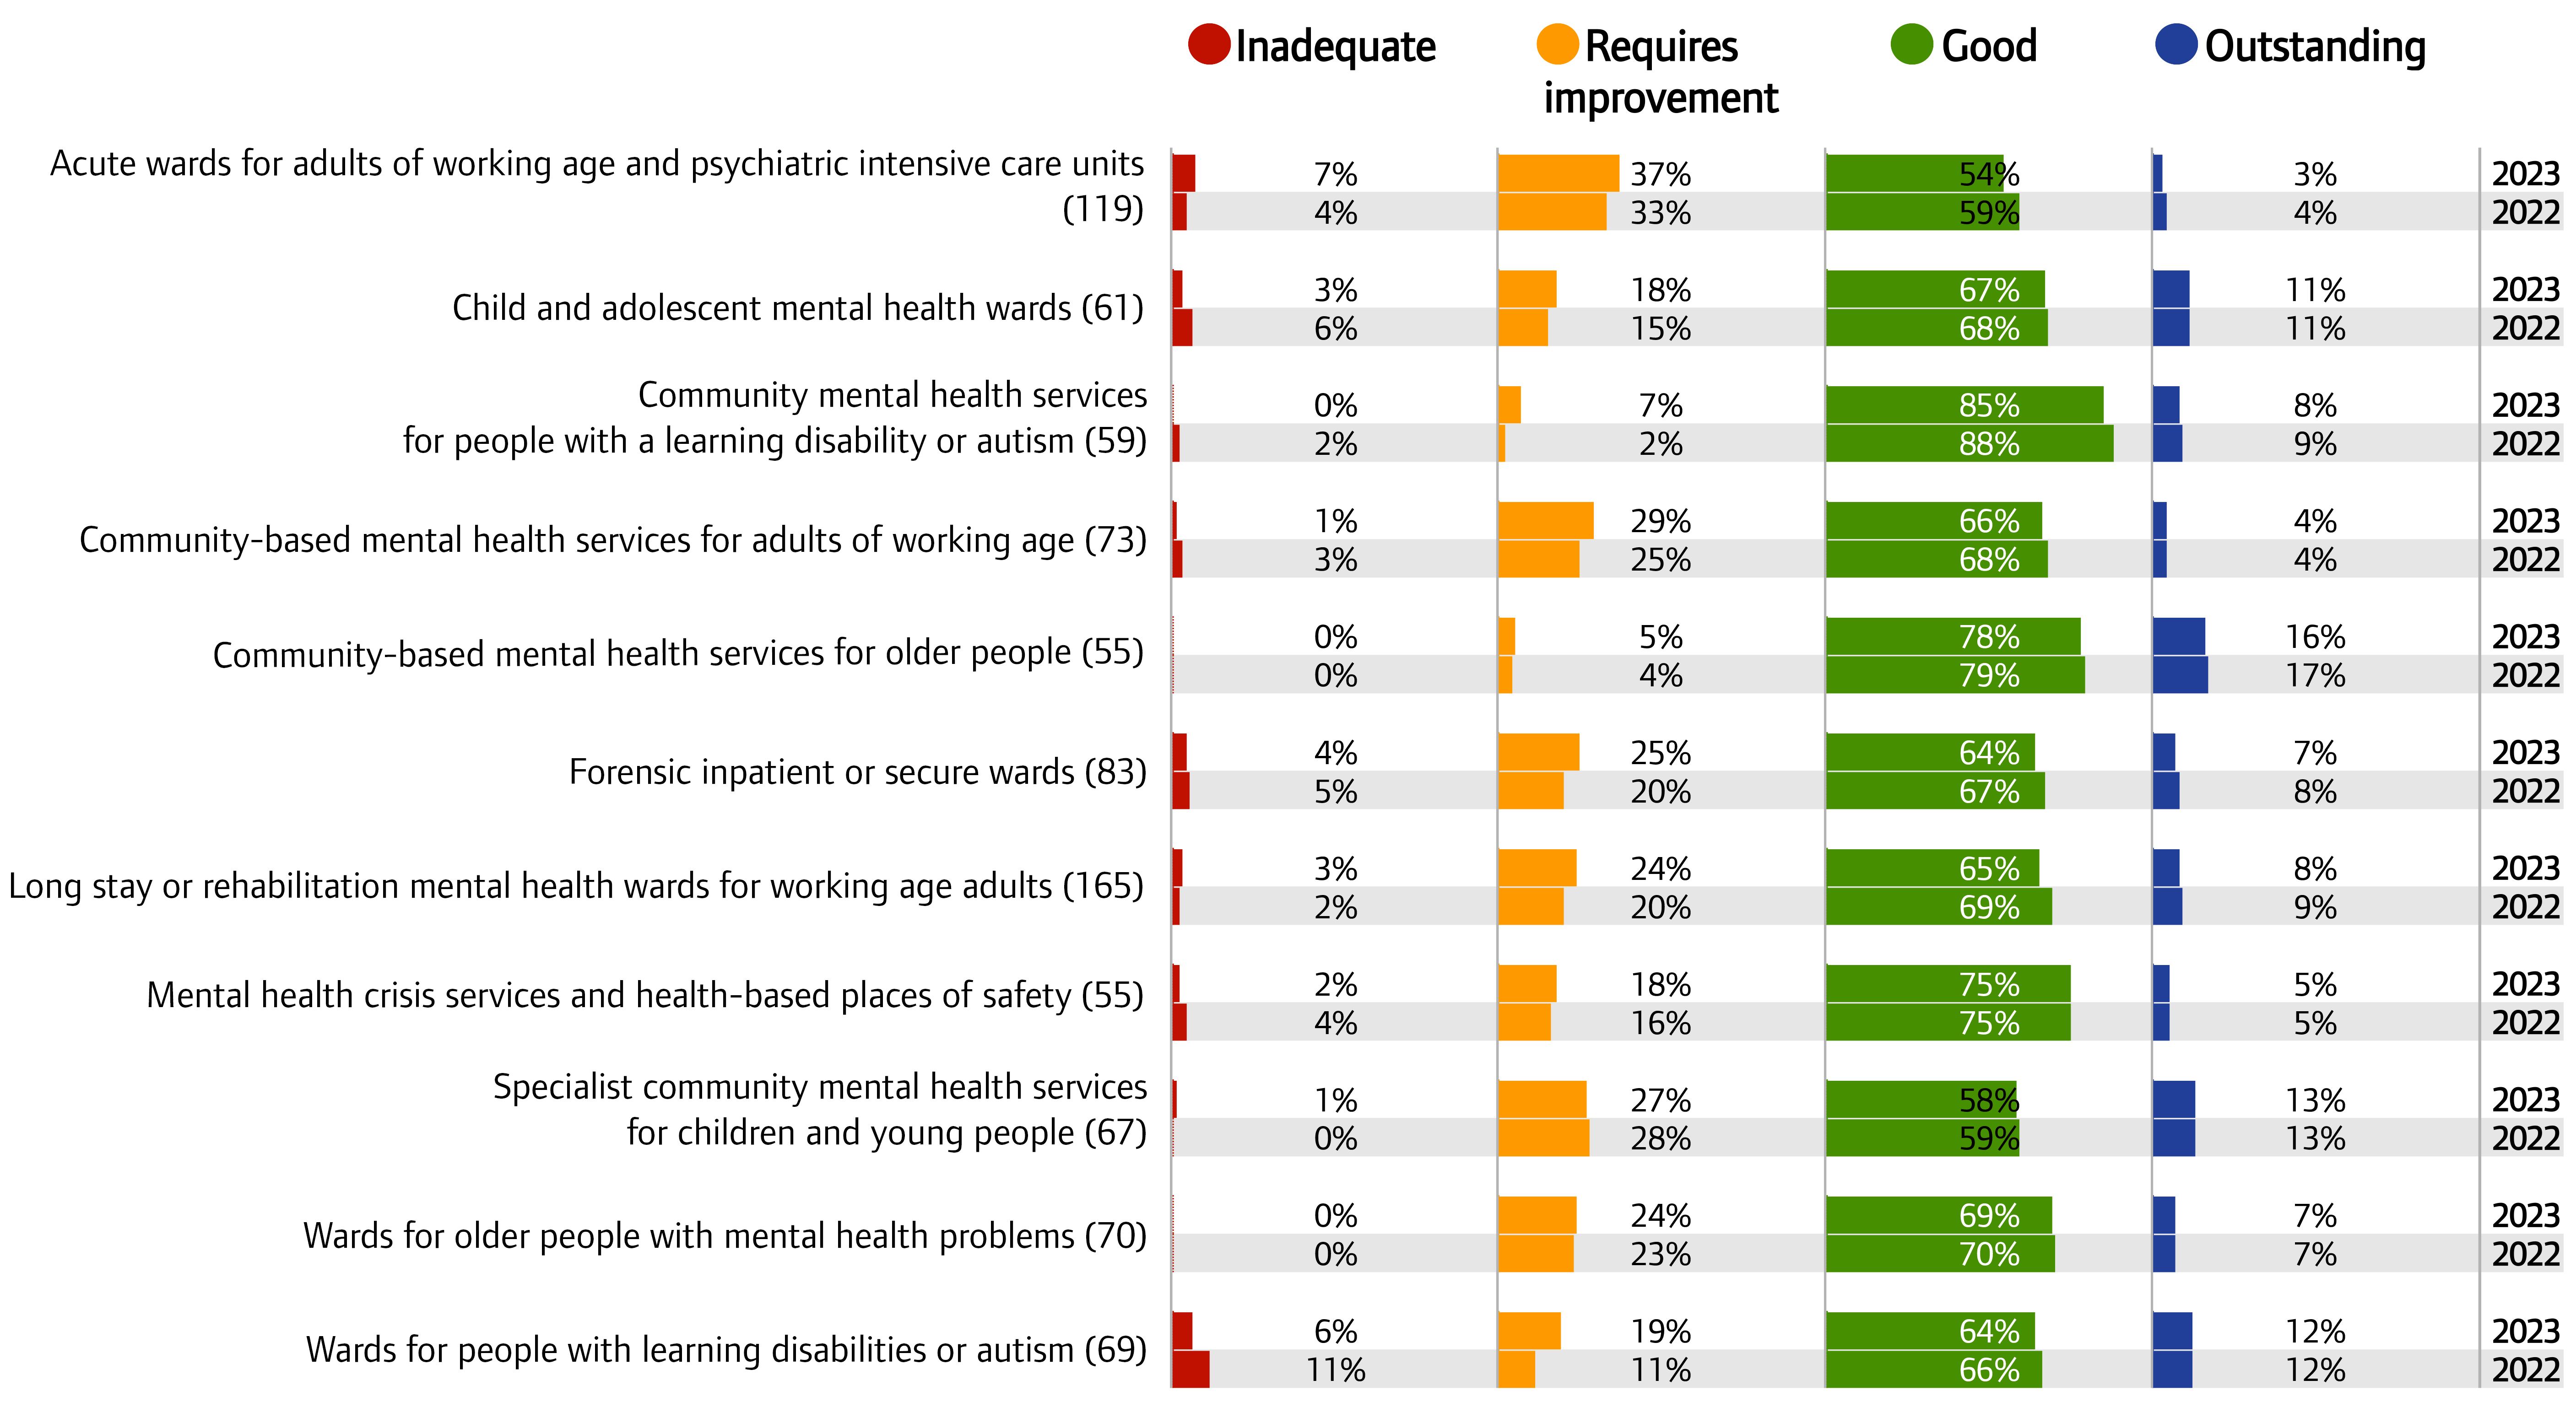
Figure A7: NHS and independent mental health core services, overall ratings, 2022 and 2023
Source: CQC ratings data, 31 July 2022 and 7 September 2023
Note: Percentages may not add to 100 due to rounding.
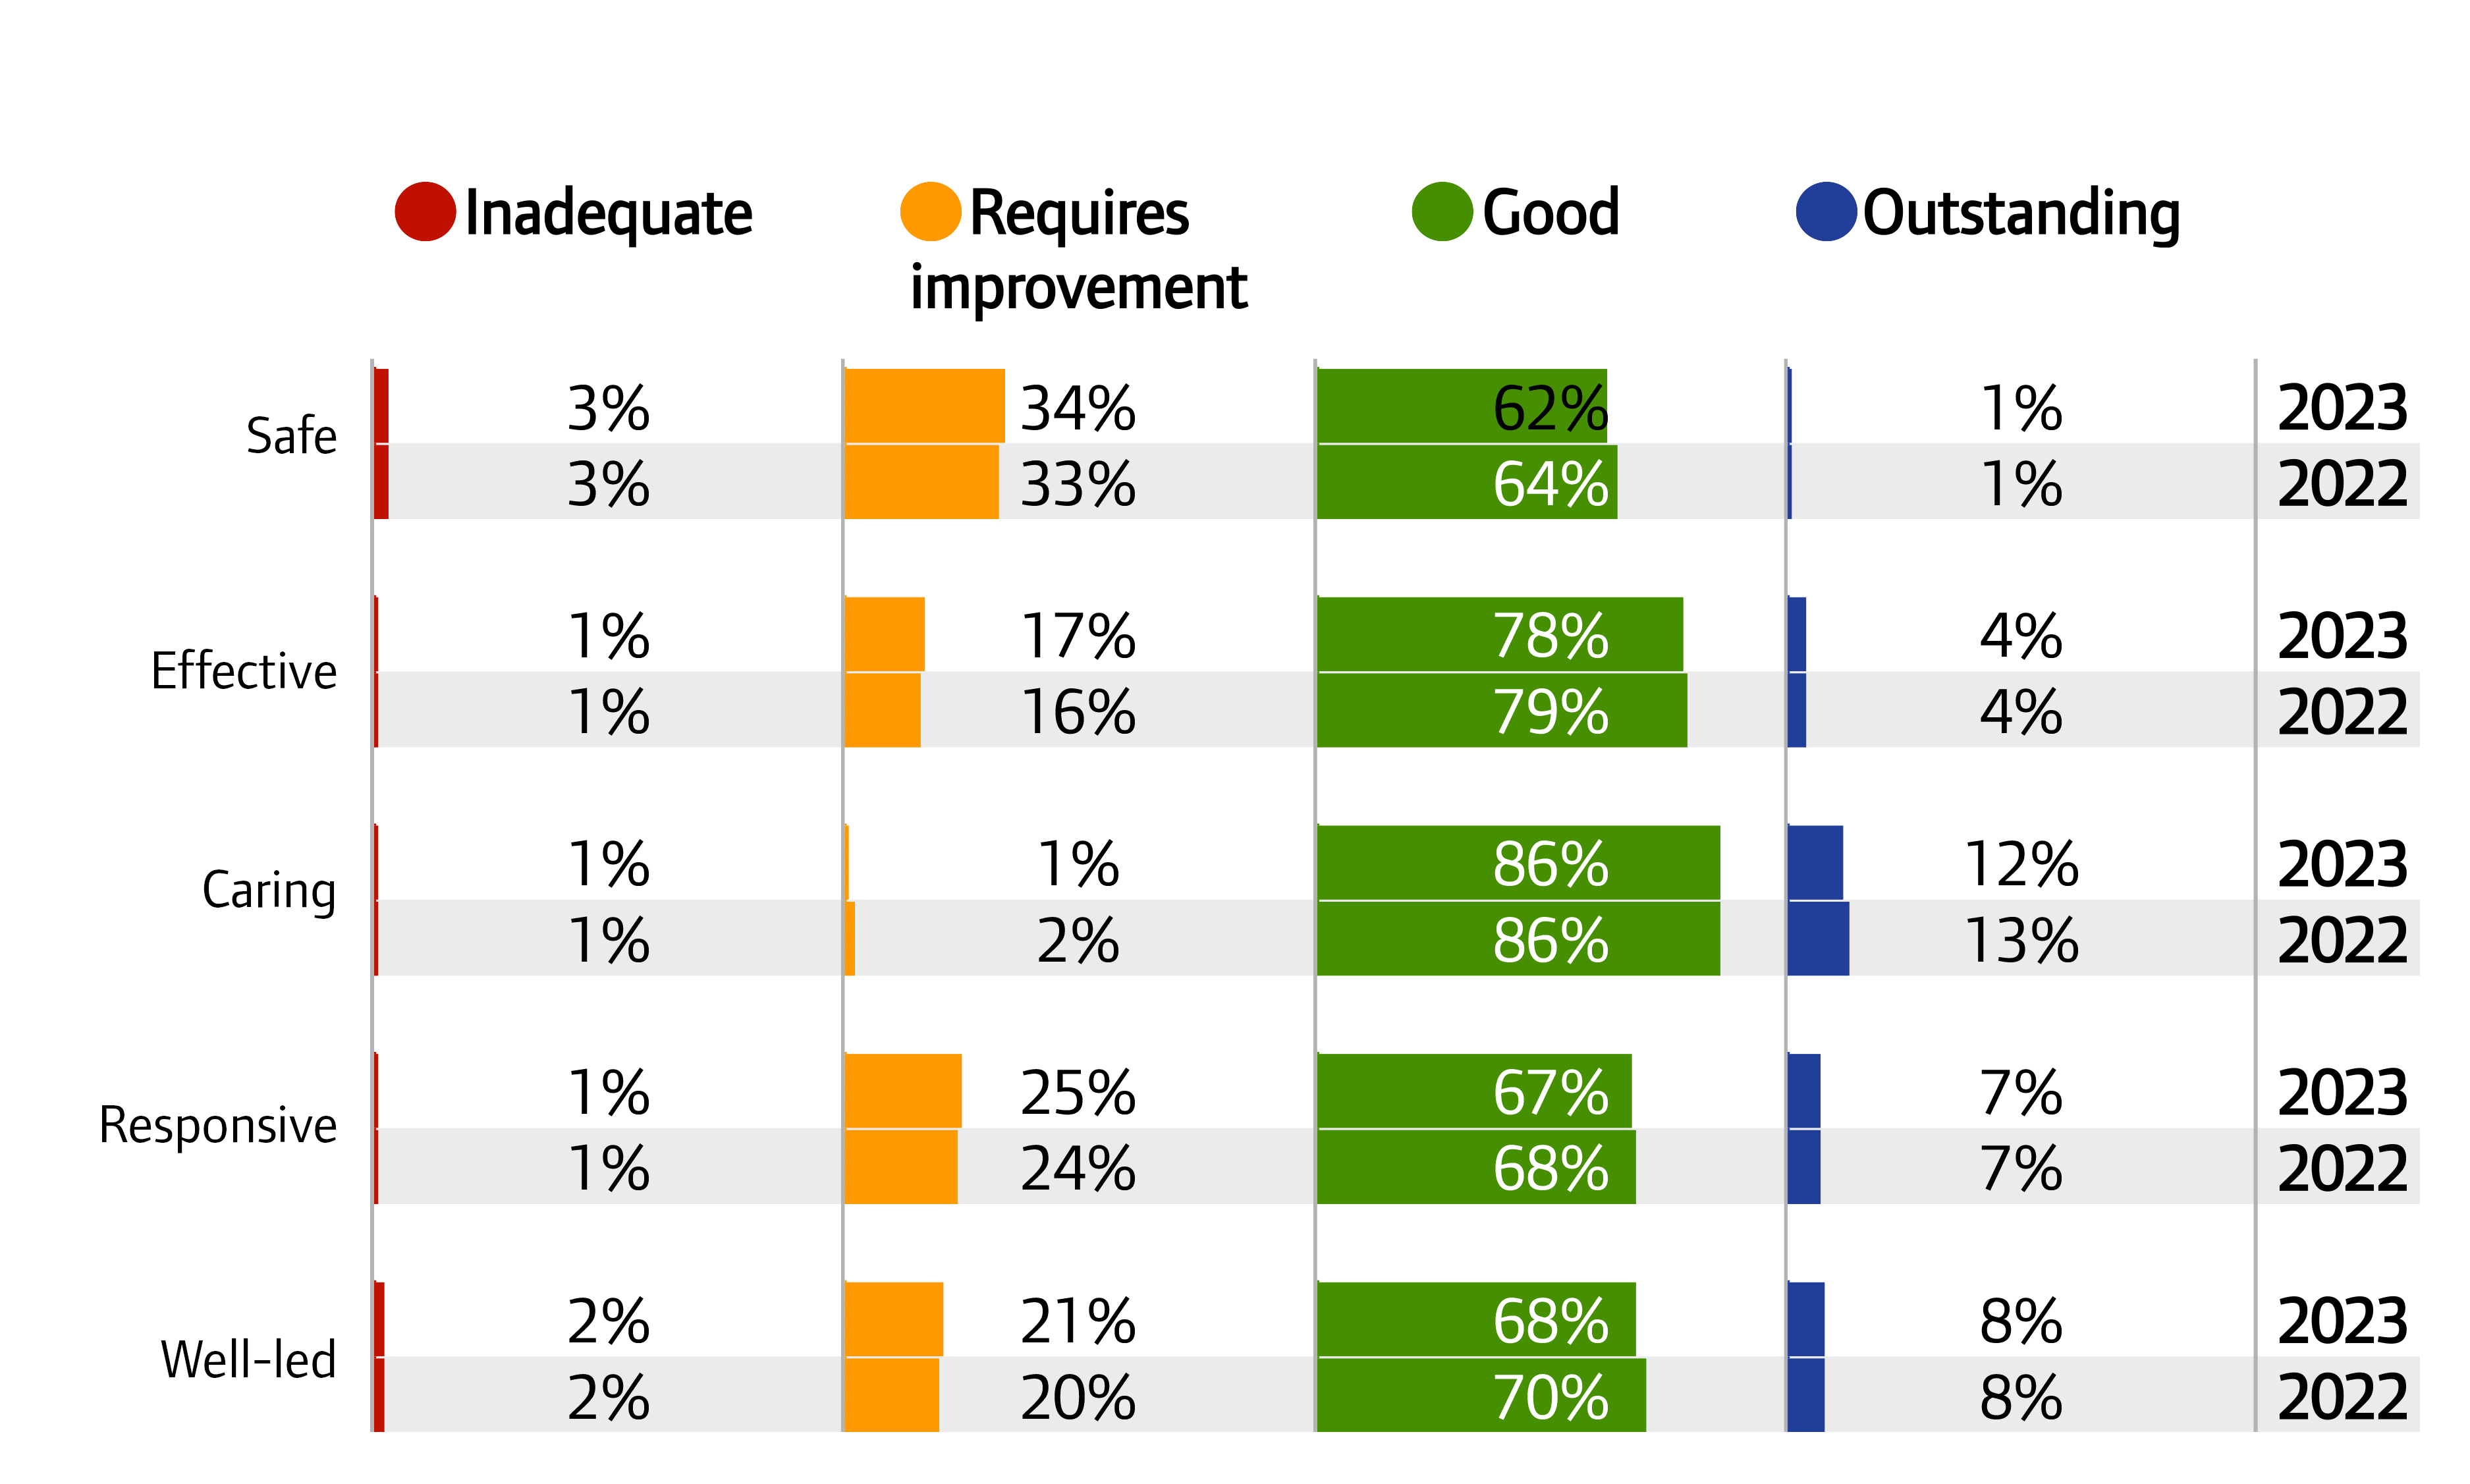
Figure A8: NHS and independent mental health core services, key question ratings, 2022 and 2023
Source: CQC ratings data, 31 July 2022 and 7 September 2023
Note: Percentages may not add to 100 due to rounding. Percentages between 0.01% and 1% have been rounded up to 1%.
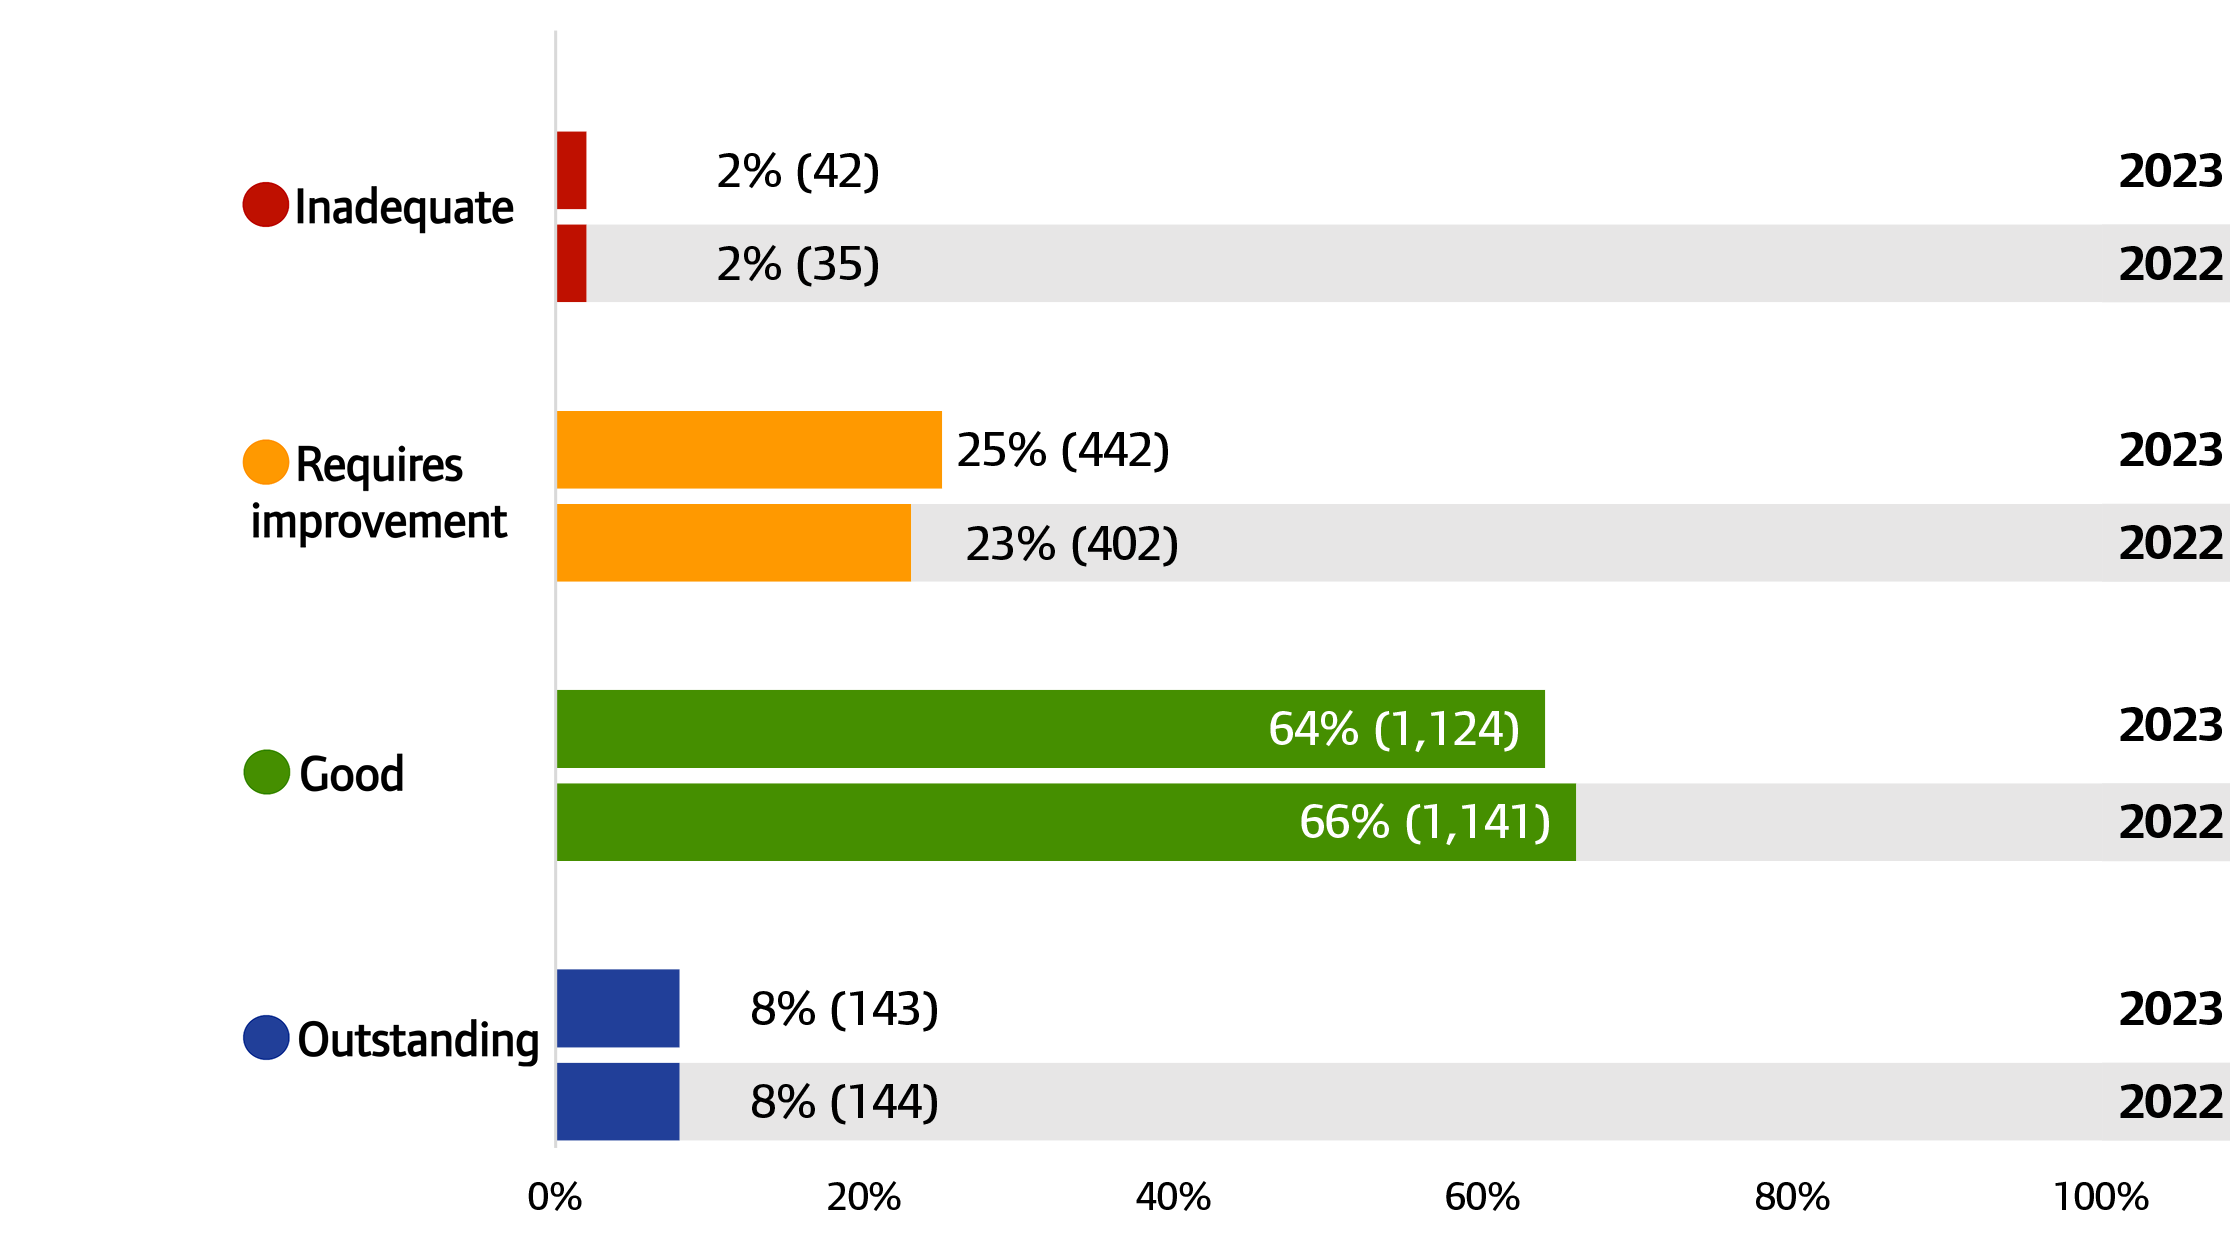
Figure A9: NHS and independent mental health core services, overall ratings, 2022 and 2023
Source: CQC ratings data, 31 July 2022 and 7 September 2023
Note: Percentages may not add to 100 due to rounding. Percentages between 0.01% and 1% have been rounded up to 1%.
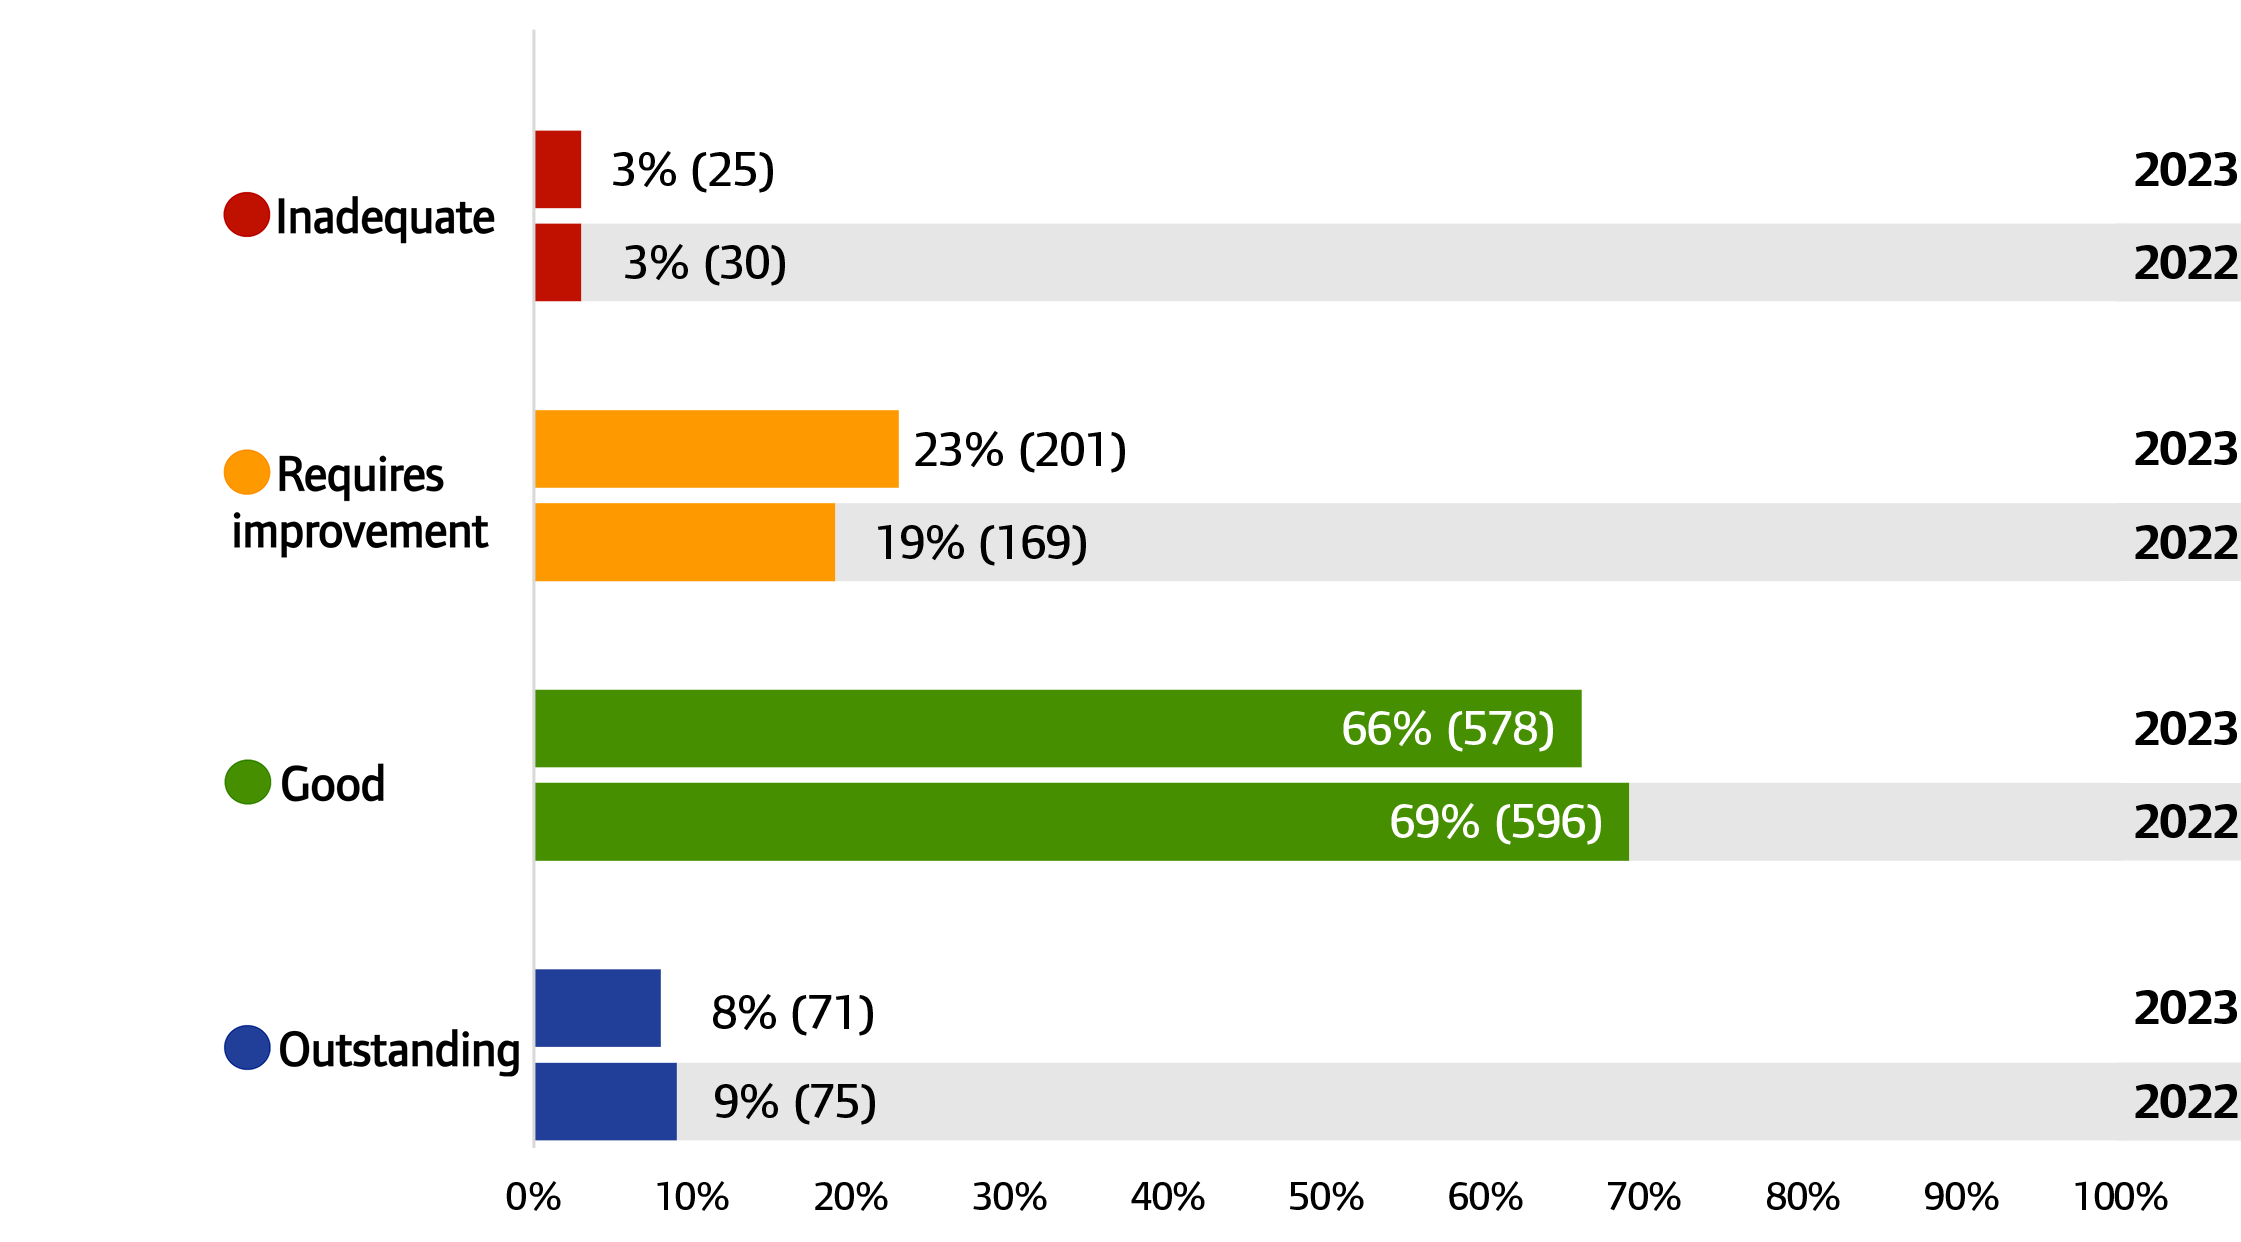
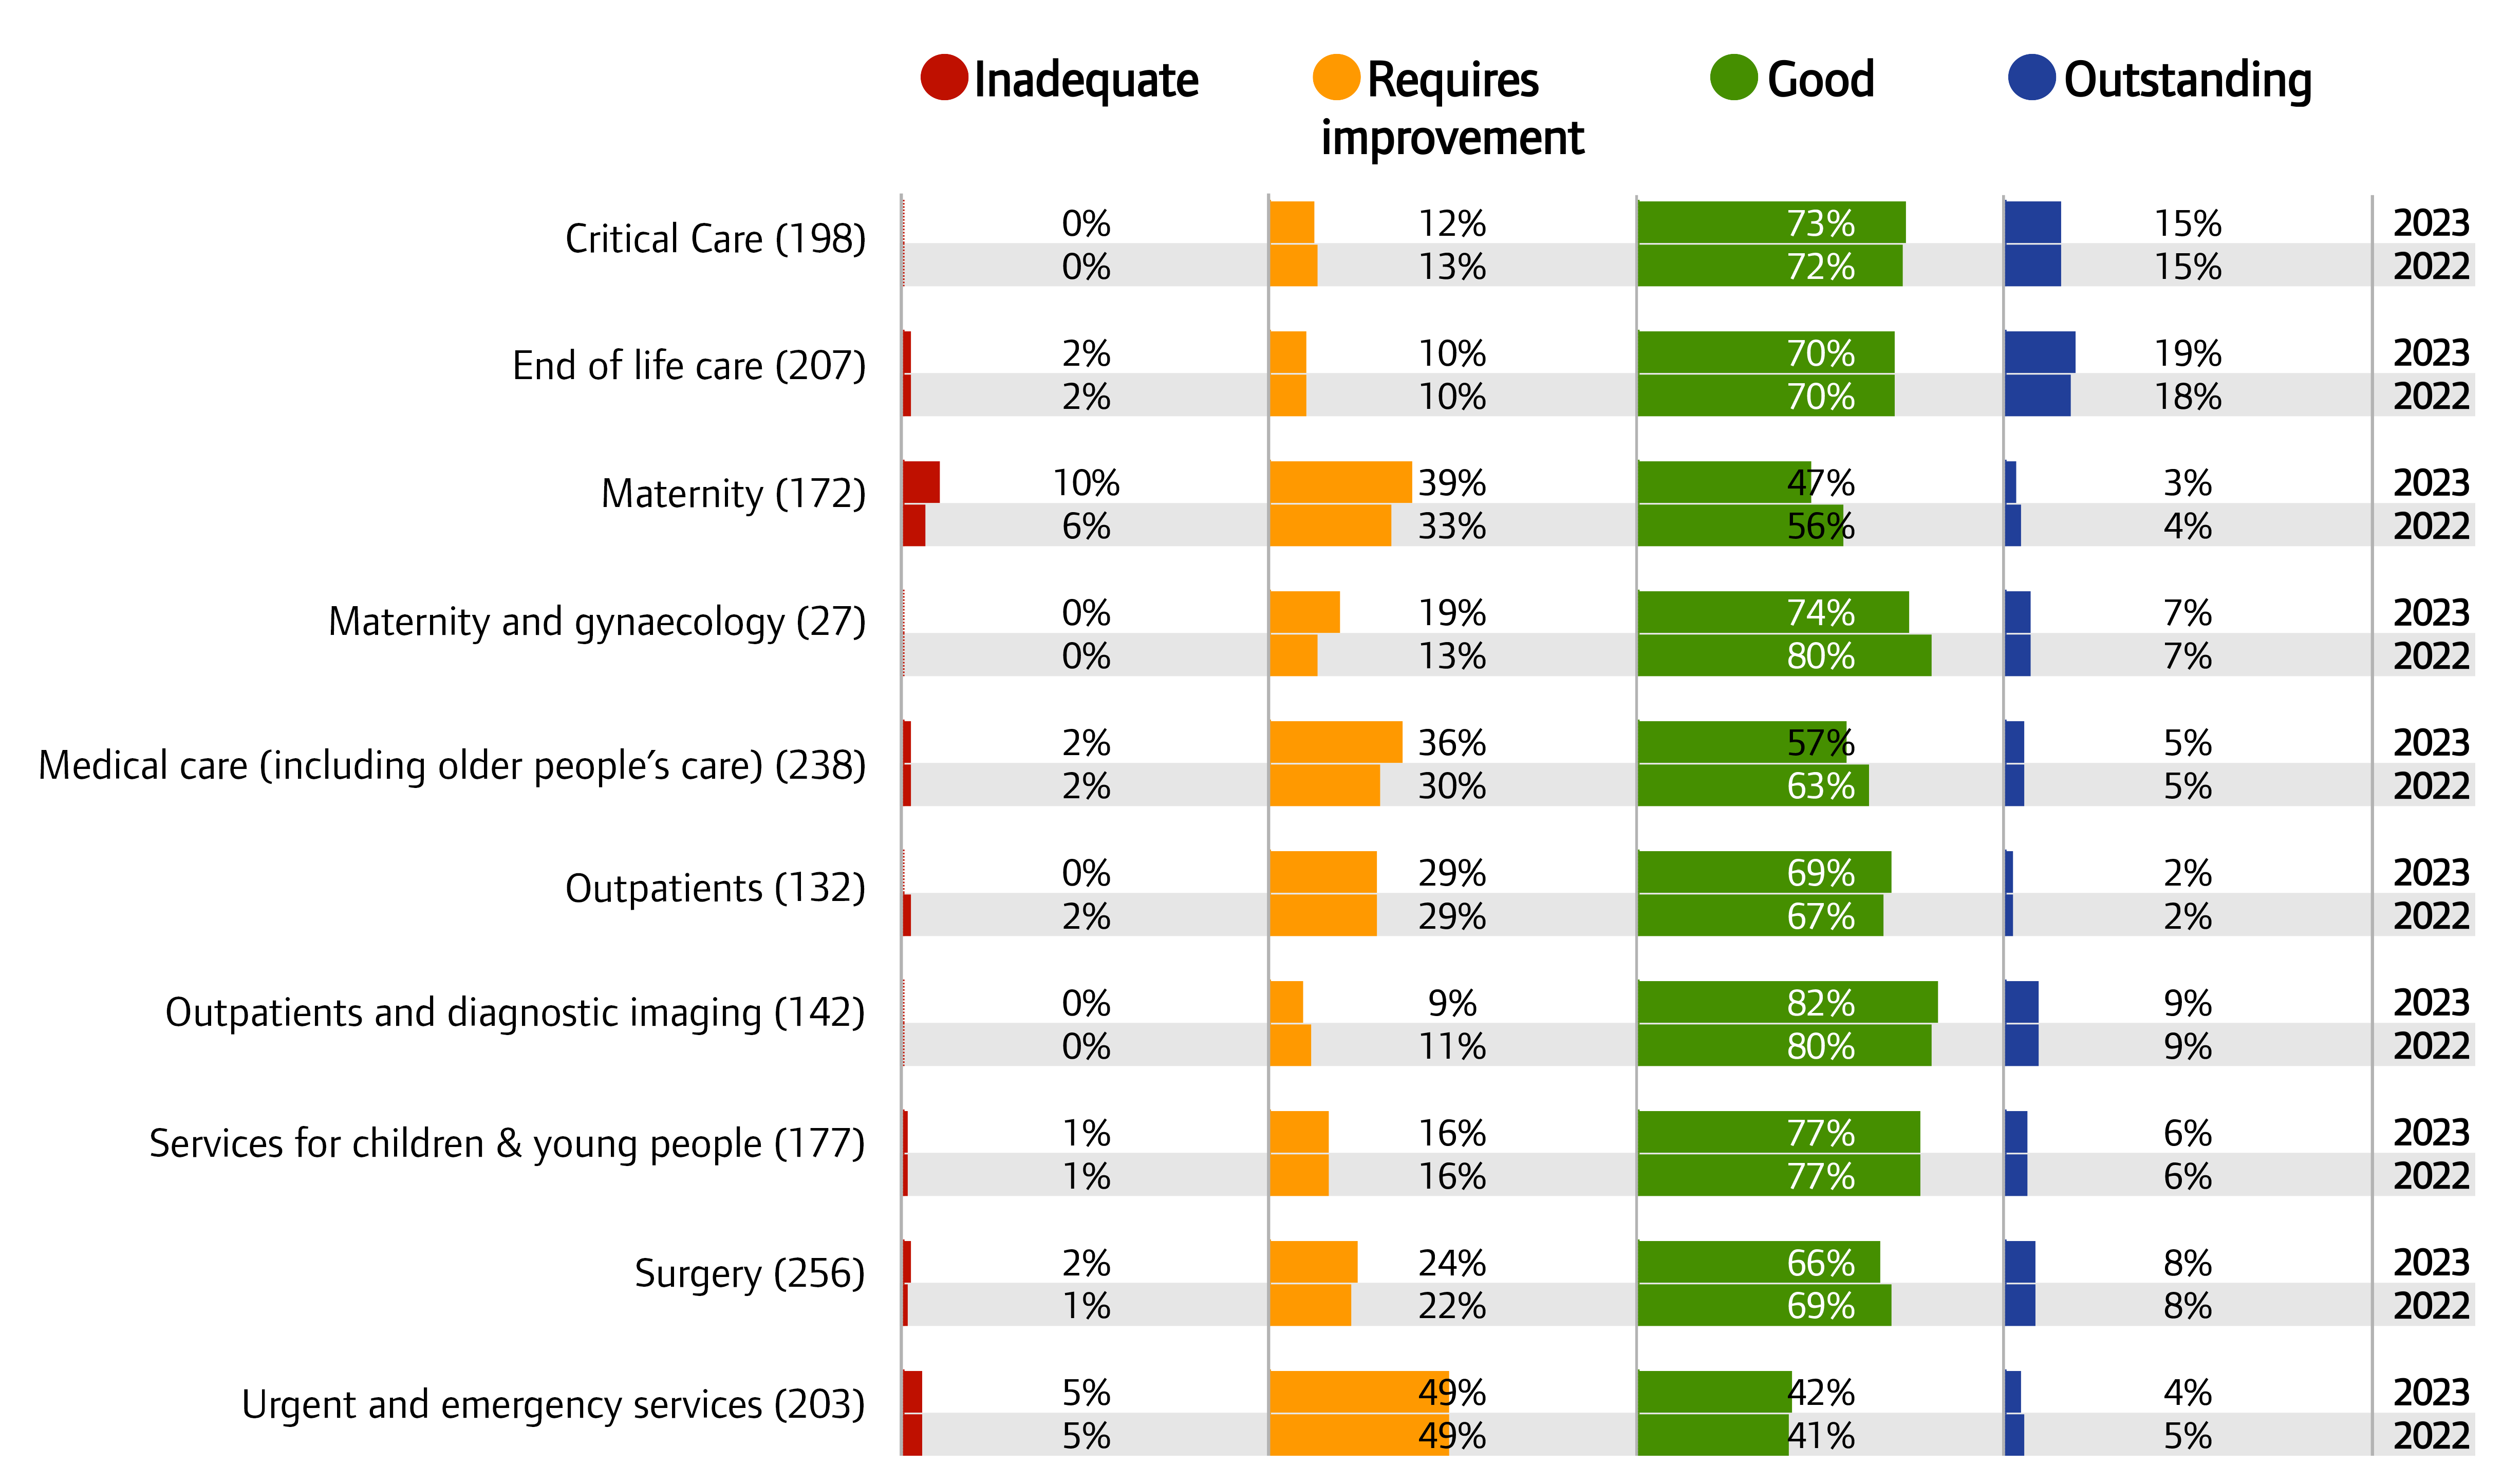
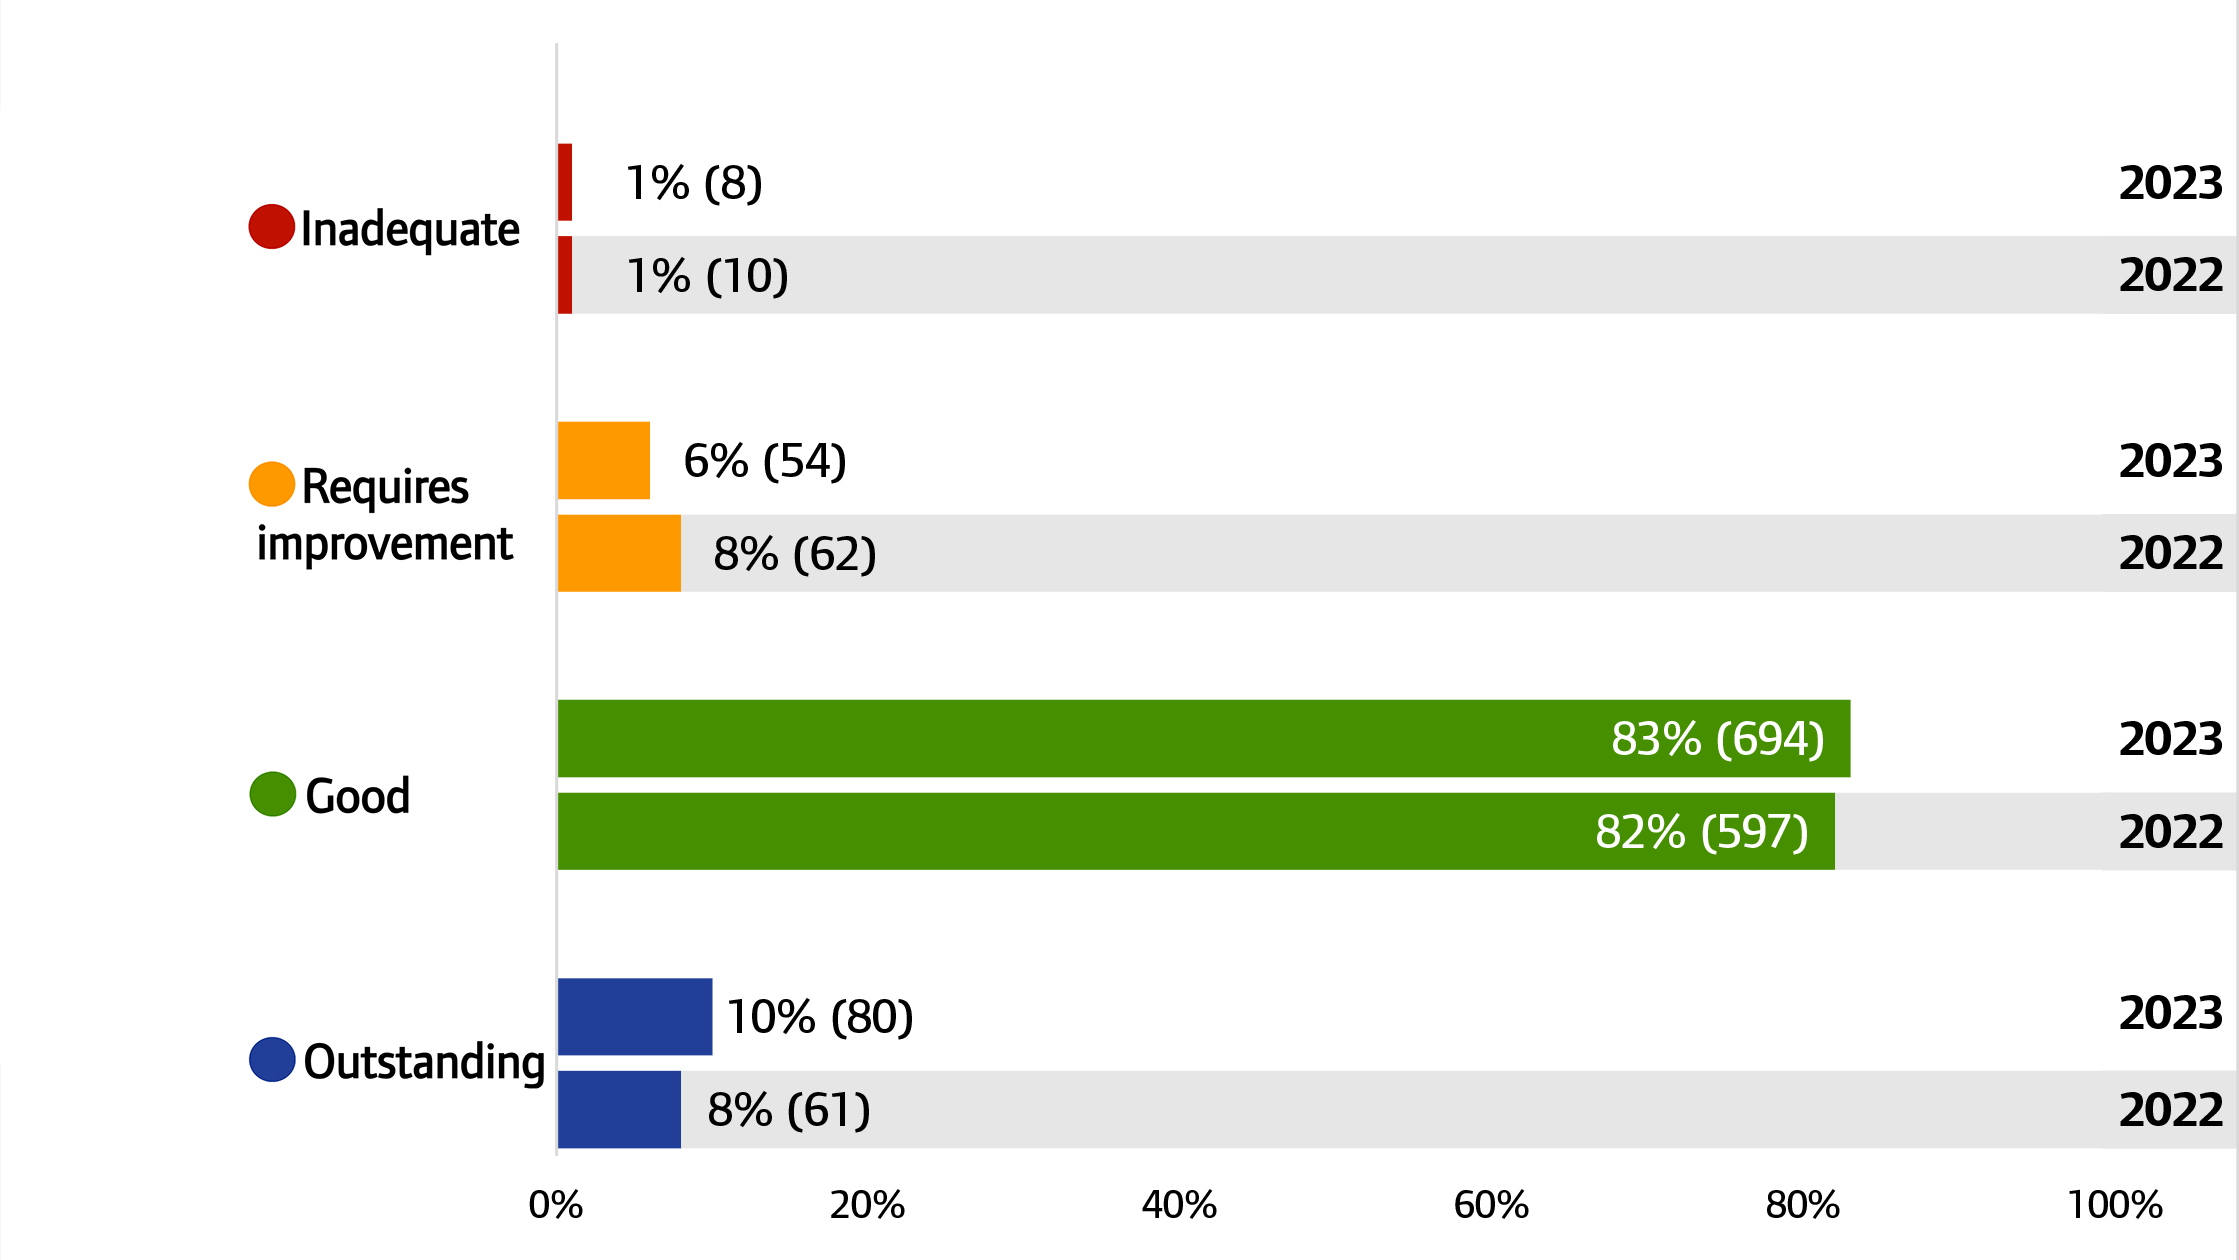
Figure A10: NHS acute core service, overall ratings, 2022 and 2023
Source: CQC ratings data, 31 July 2022 and 7 September 2023
Note: Percentages may not add to 100 due to rounding.
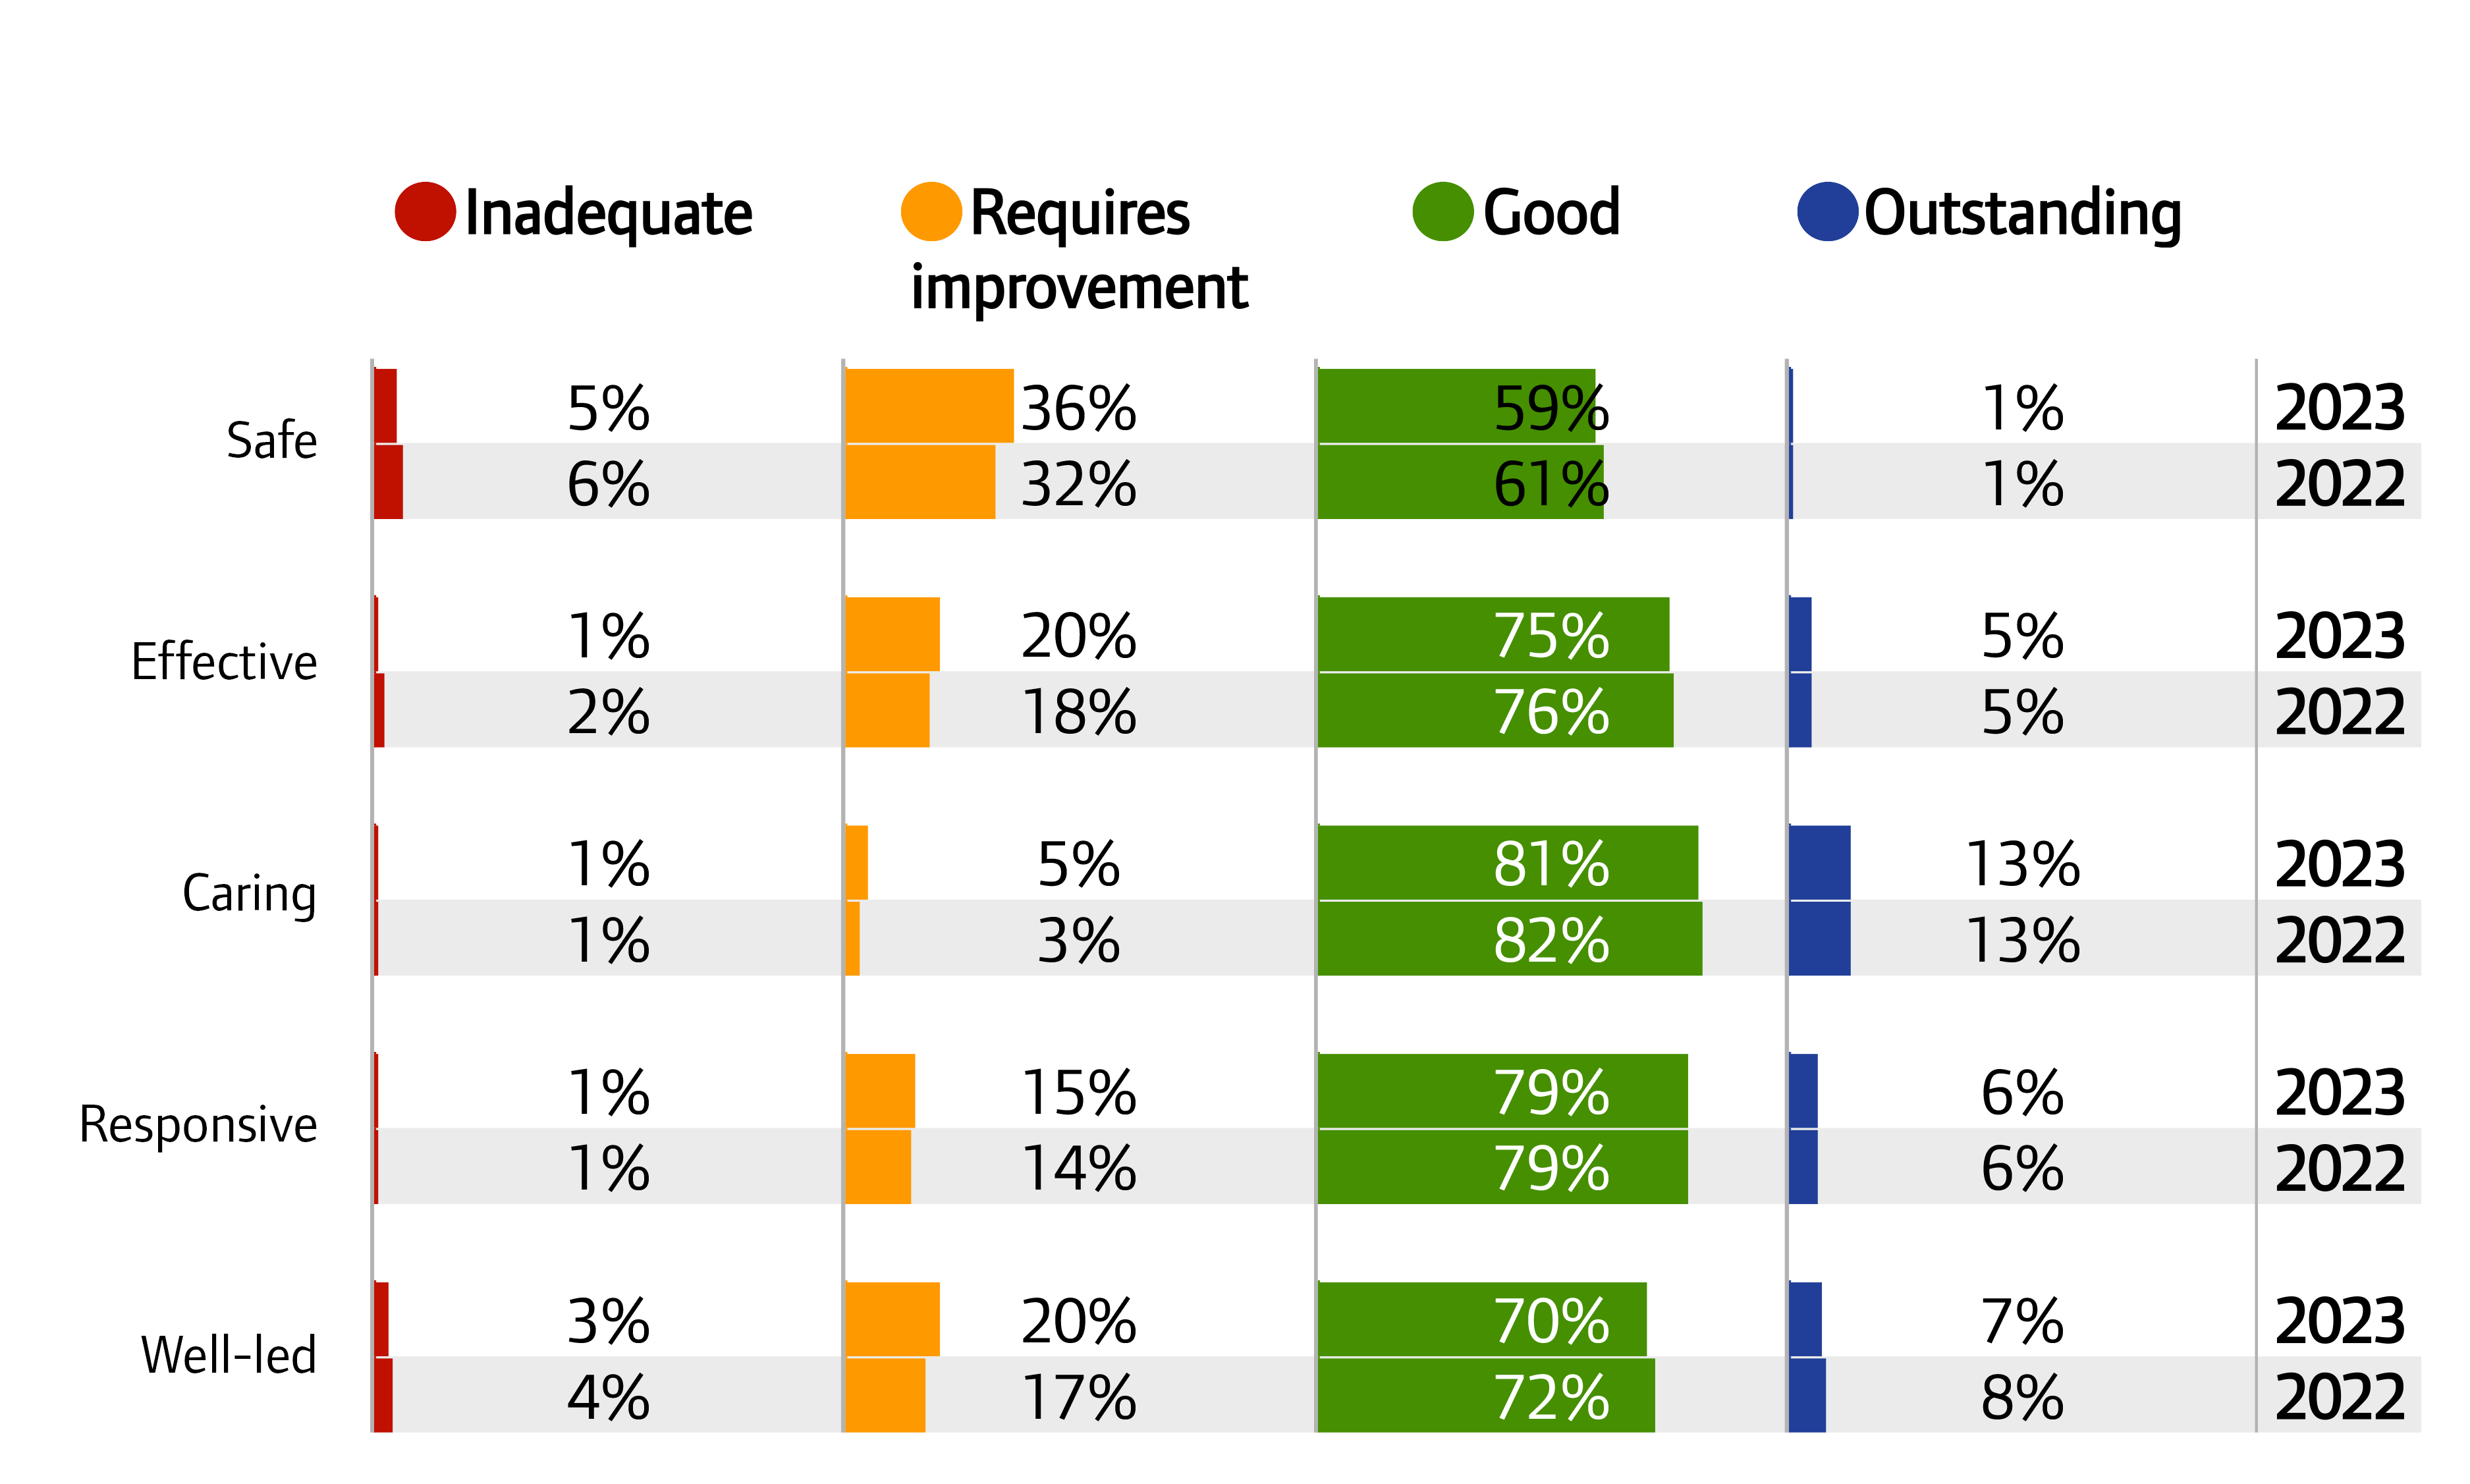
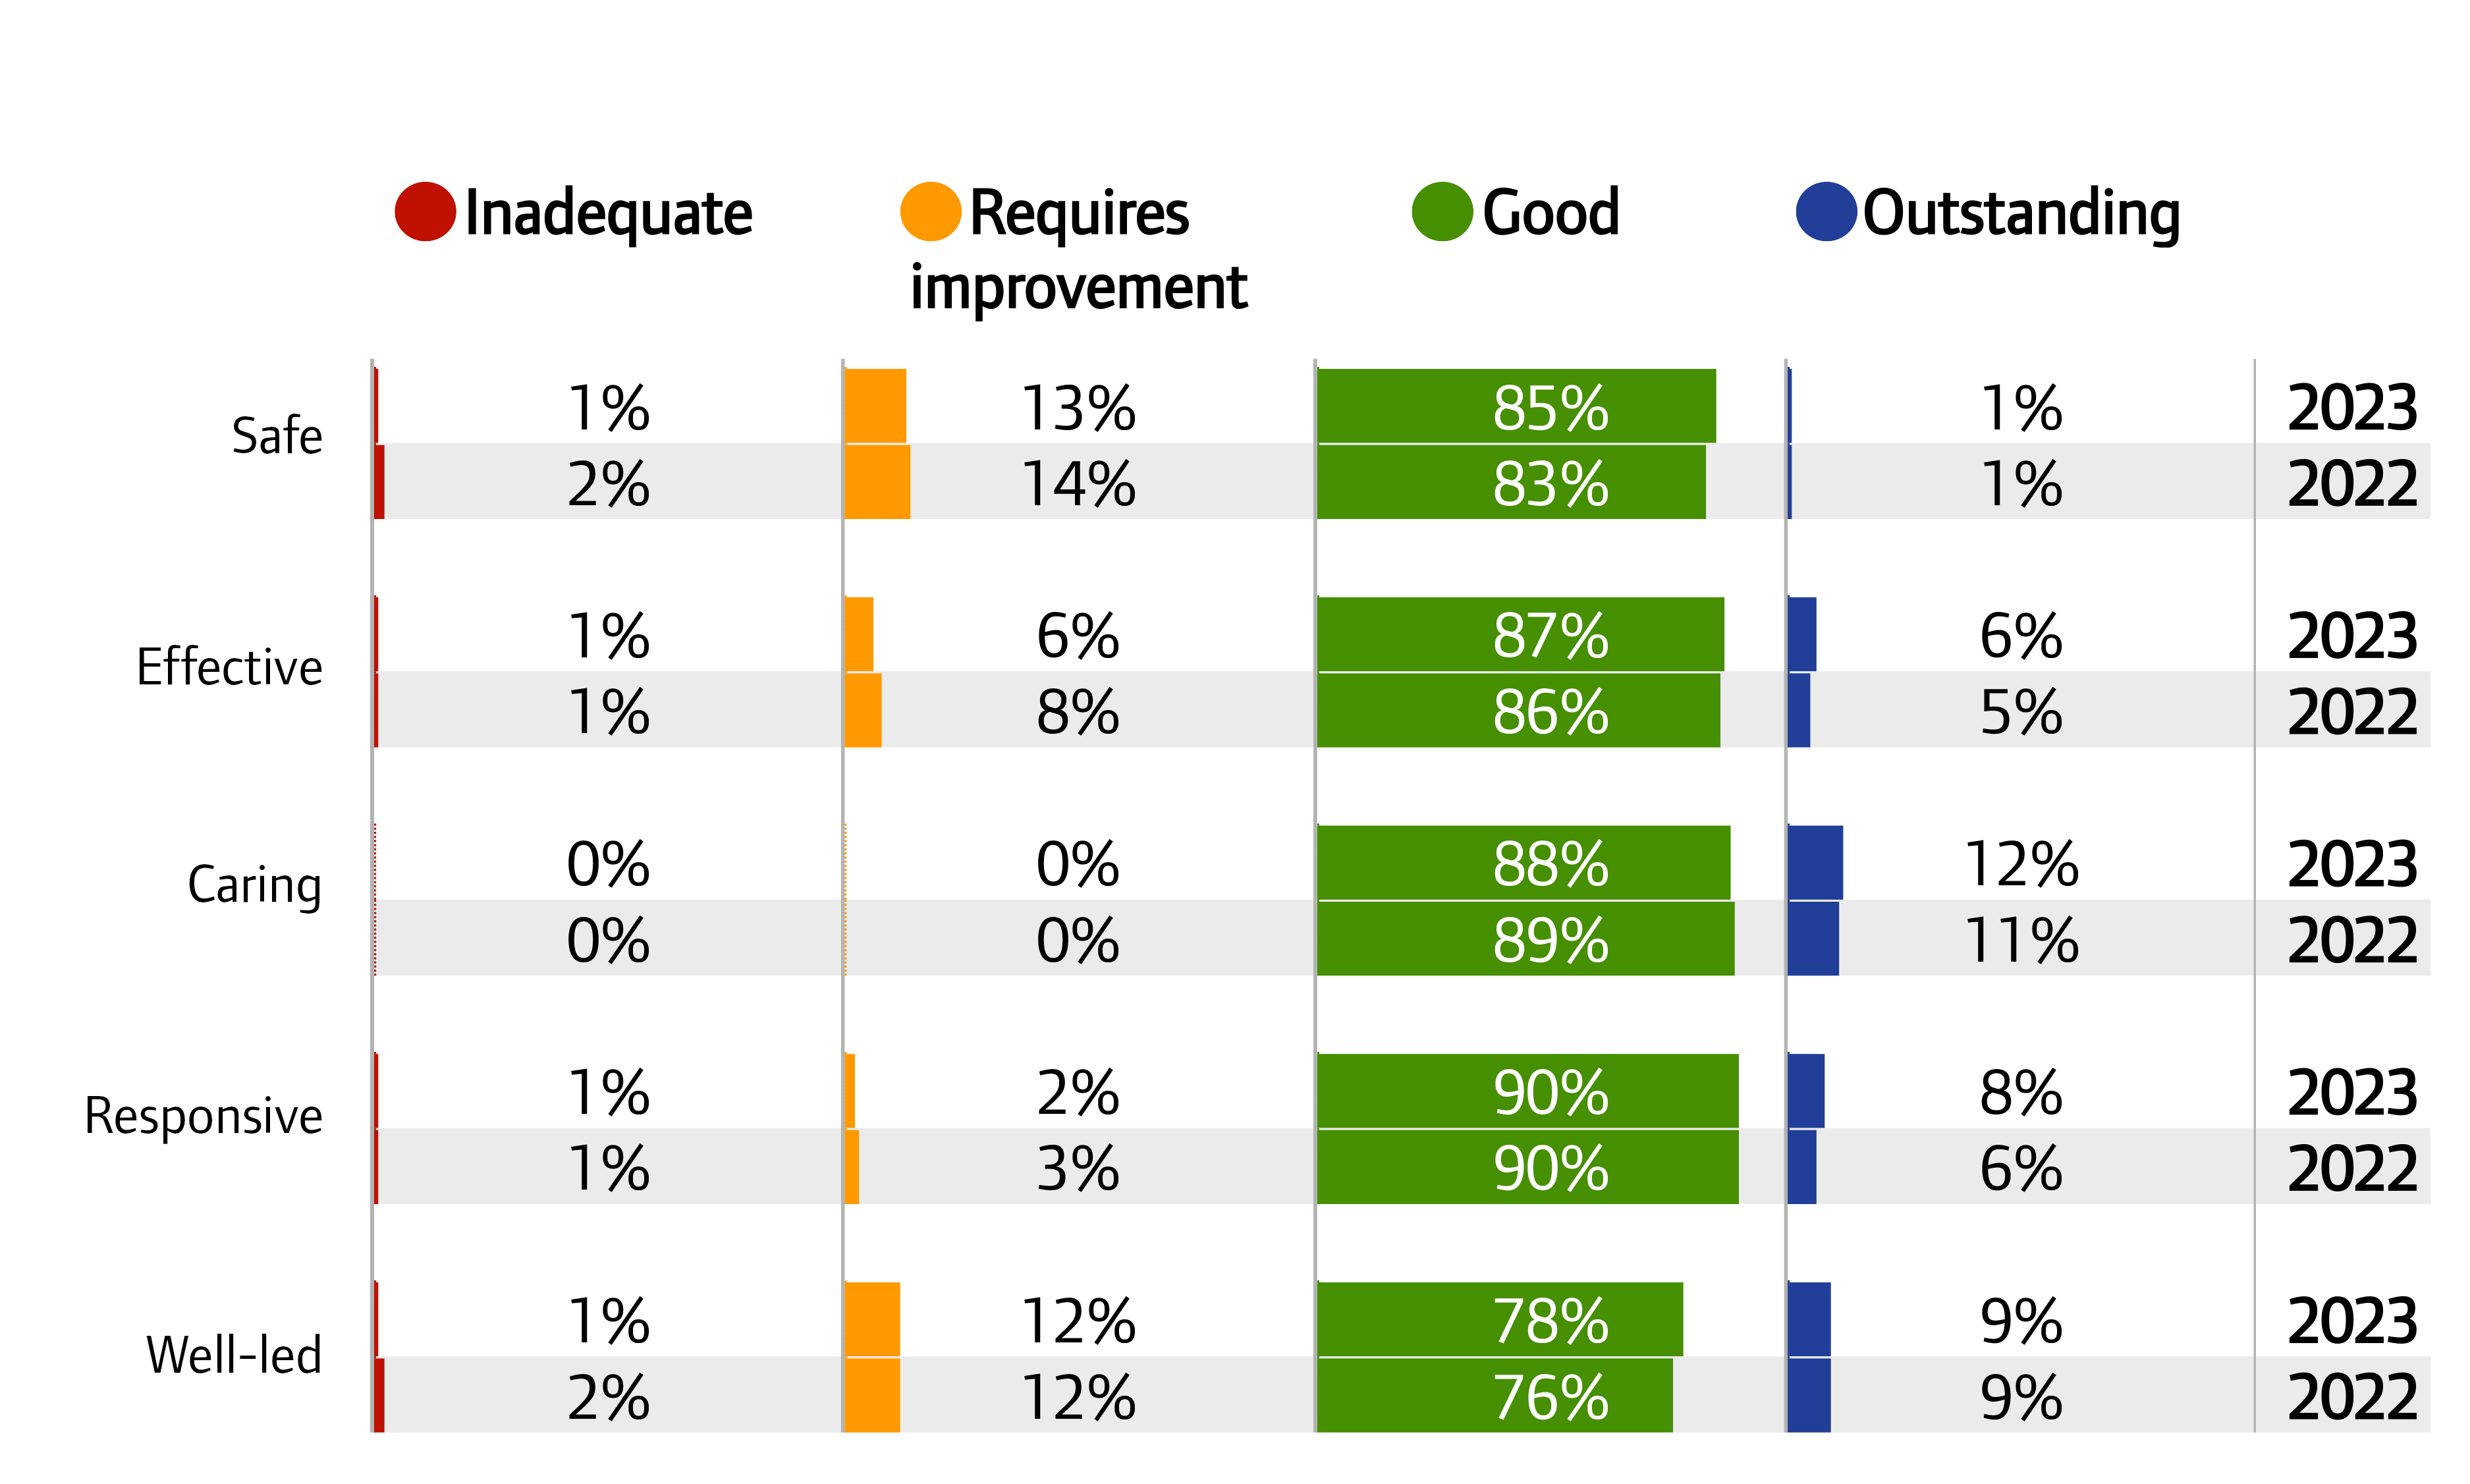
Figure A11: NHS acute core service, key question ratings, 2022 and 2023
Source: CQC ratings data, 31 July 2022 and 7 September 2023
Note: Percentages may not add to 100 due to rounding. Percentages between 0.01% and 1% have been rounded up to 1%.
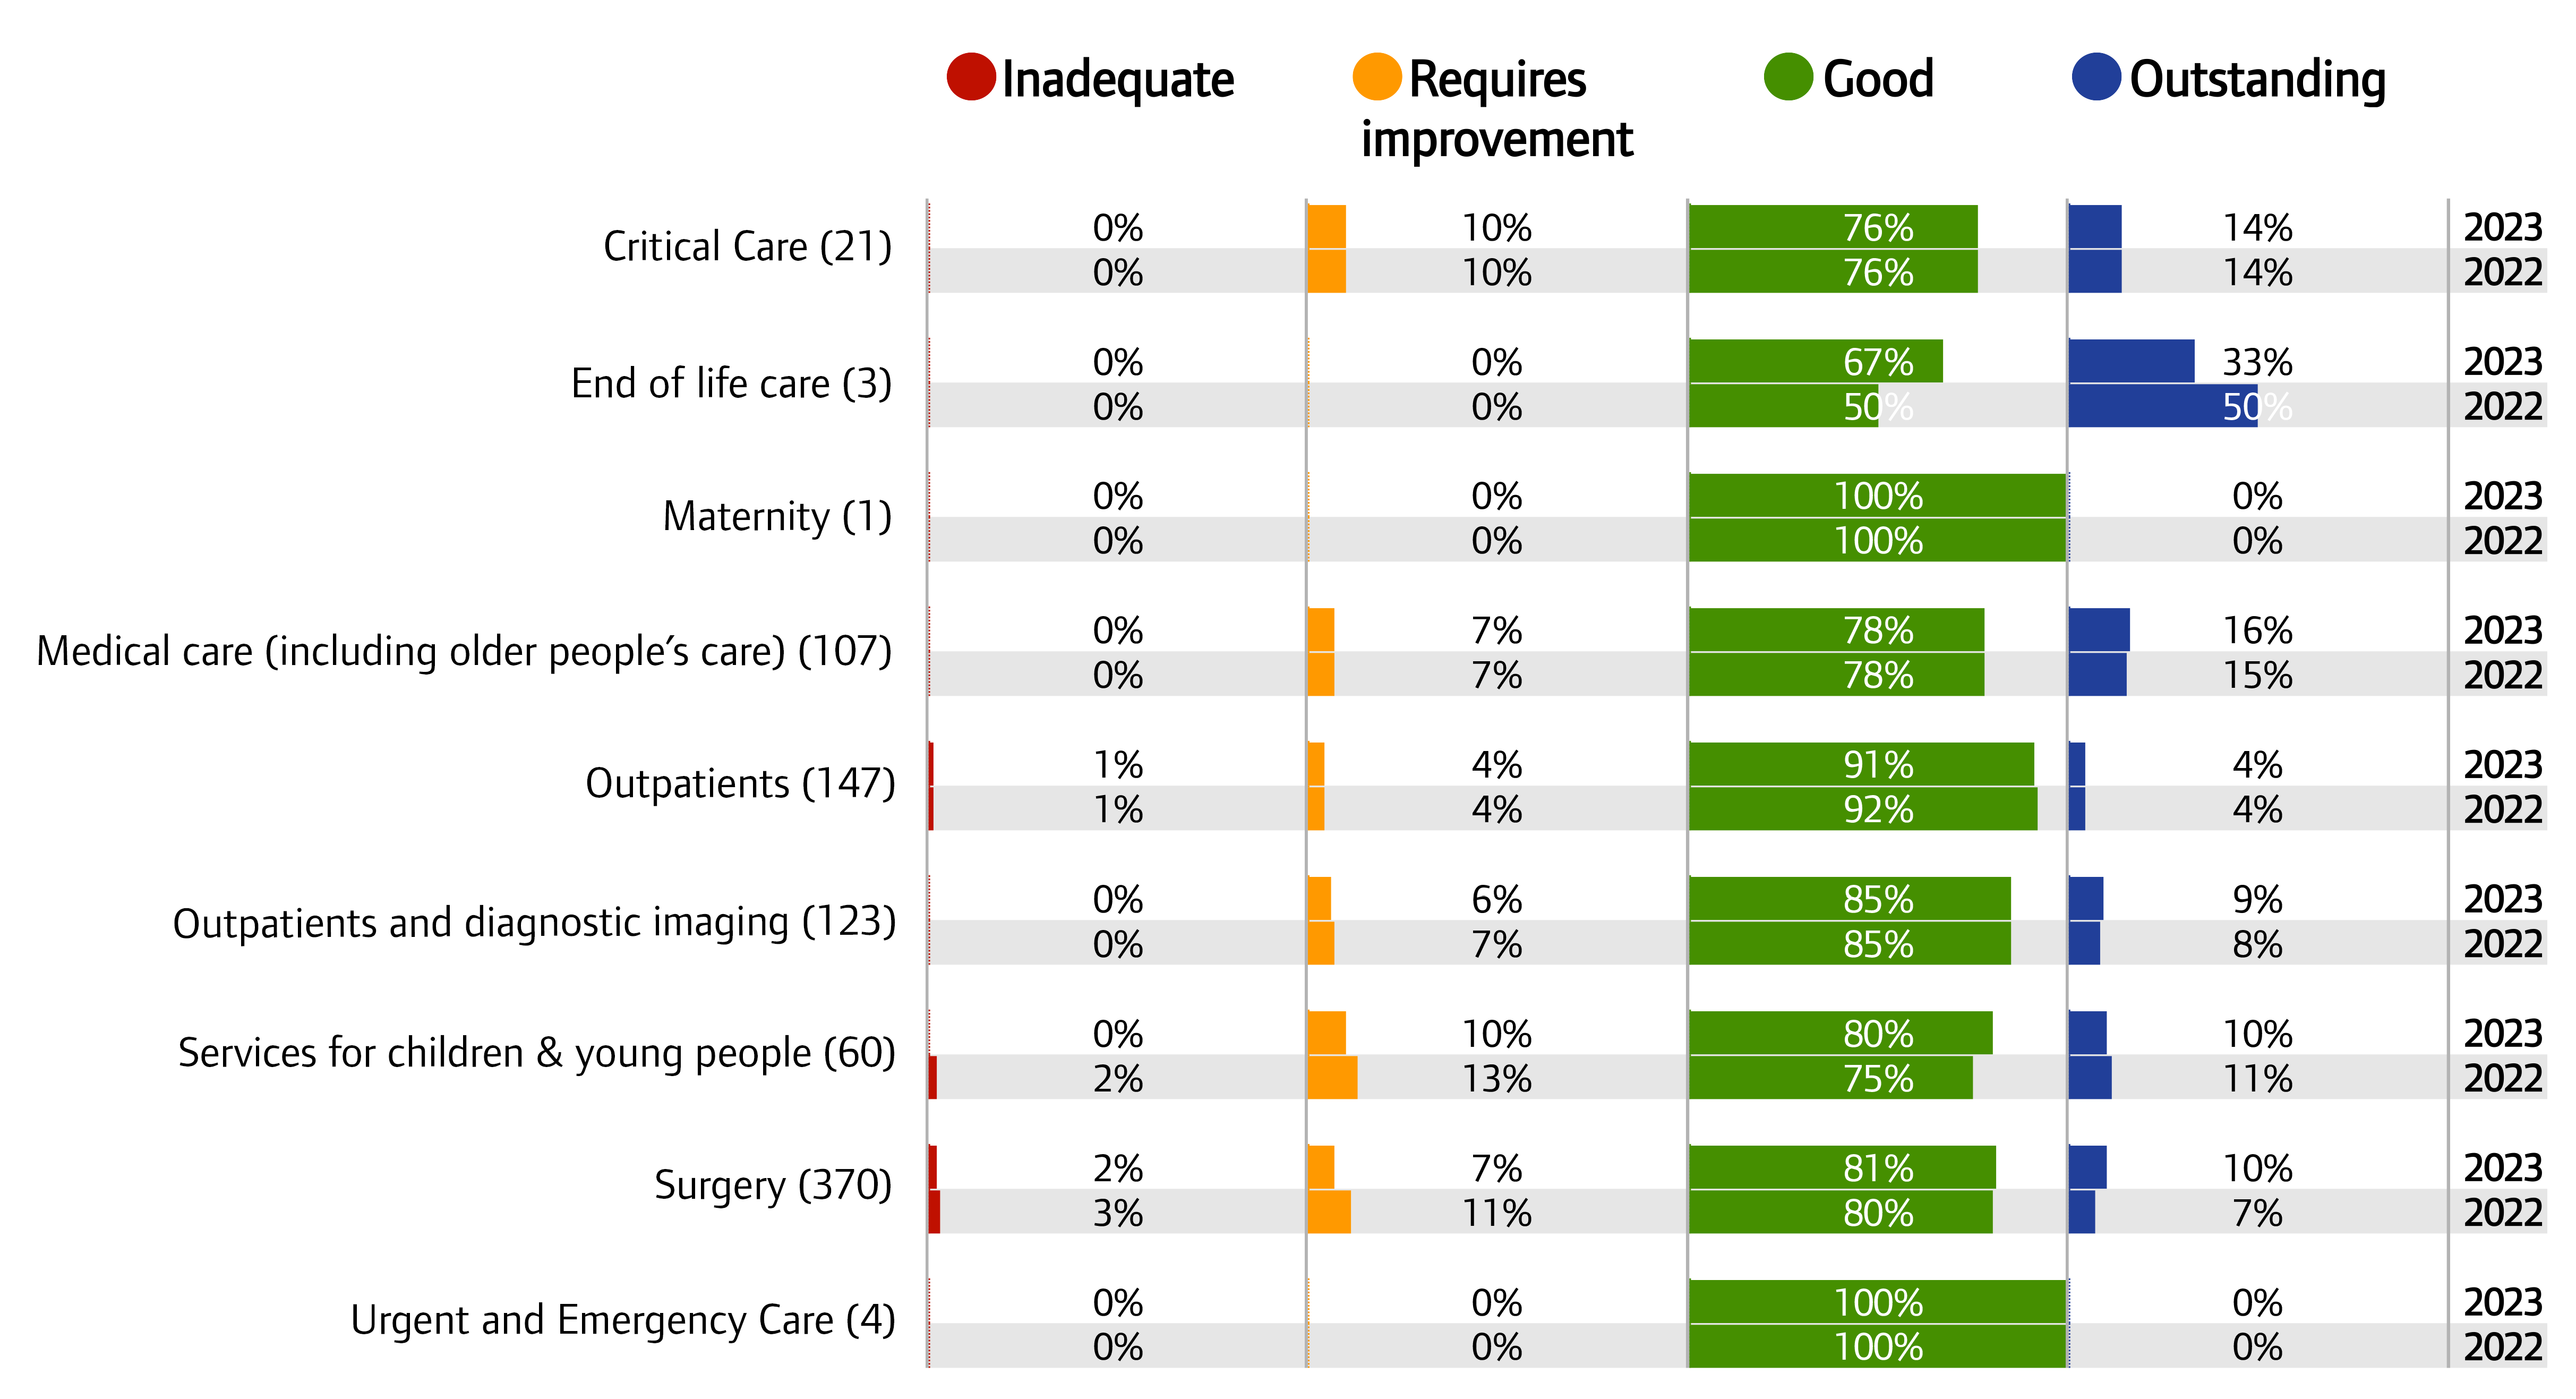
Figure A12: NHS acute core service, overall ratings, 2022 and 2023
Source: CQC ratings data, 31 July 2022 and 7 September 2023
Note: At key question level for the 2023 ratings ‘insufficient evidence to rate’ ratings represented the following proportions of the total (including ‘insufficient evidence to rate’): 0.5% for end of life care and Urgent and emergency services, and 0.1% of all core services. Percentages may not add to 100 due to rounding. Percentages between 0.01% and 1% have been rounded up to 1%.
Figure A13: Independent health acute core services, overall ratings, 2022 and 2023
Source: CQC ratings data, 31 July 2022 and 7 September 2023
Note: Percentages may not add to 100 due to rounding. Percentages between 0.01% and 1% have been rounded up to 1%.
Figure A14: Independent health acute core services, key question rations, 2022 and 2023
Source: CQC ratings data, 31 July 2022 and 7 September 2023
Note: Percentages may not add to 100 due to rounding. Percentages between 0.01% and 1% have been rounded up to 1%.
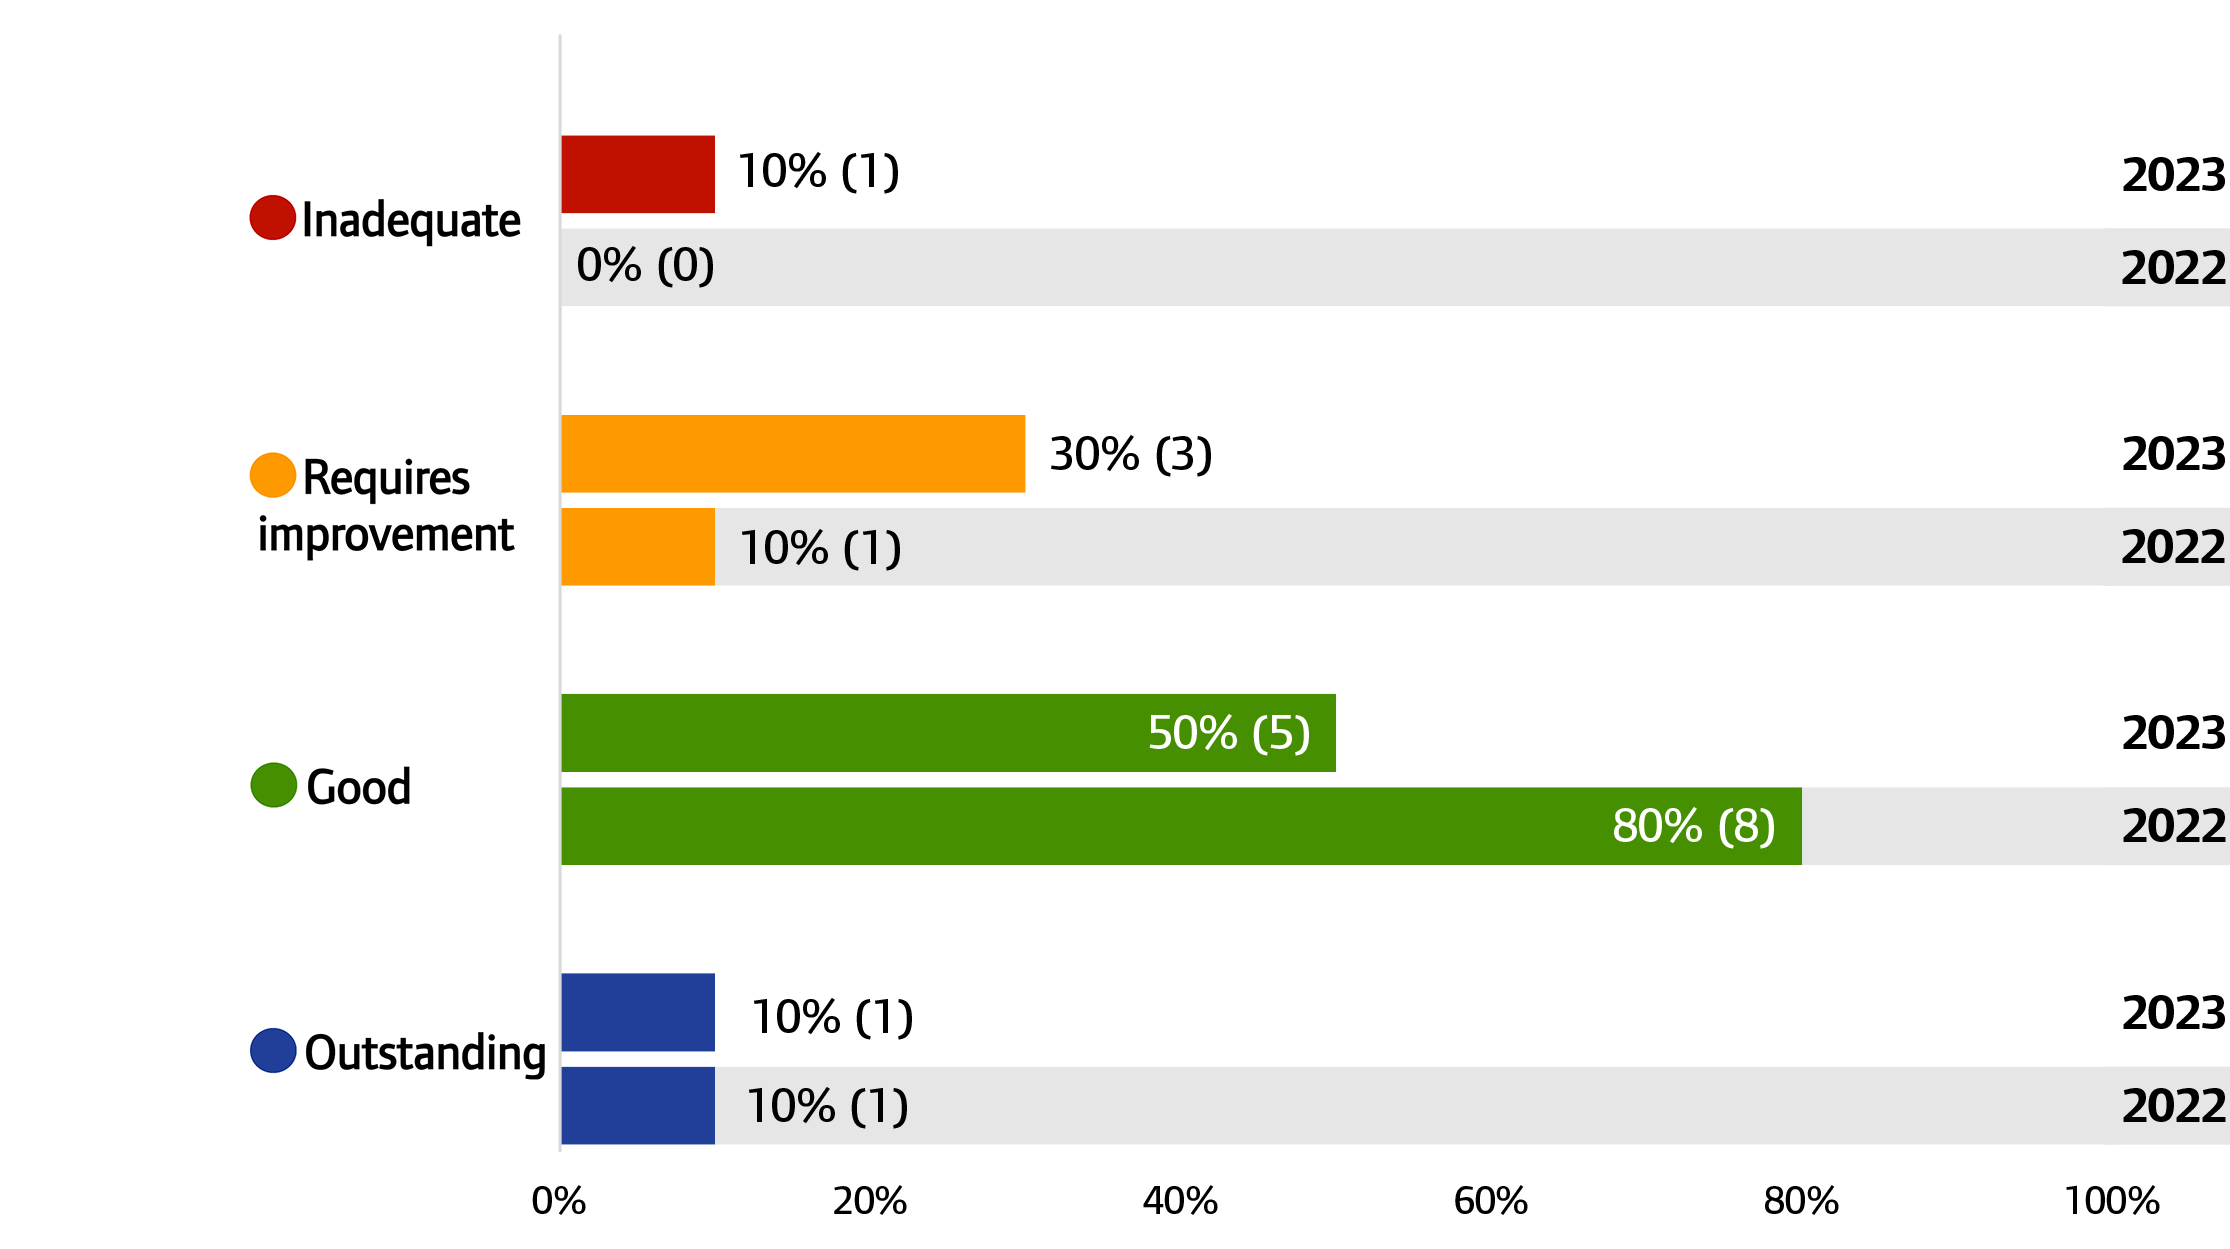
Figure A15: Independent health acute core services, overall ratings, 2022 and 2023
Source: CQC ratings data, 7 September 2023
Note: Percentages may not add to 100 due to rounding. Percentages between 0.01% and 1% have been rounded up to 1%.
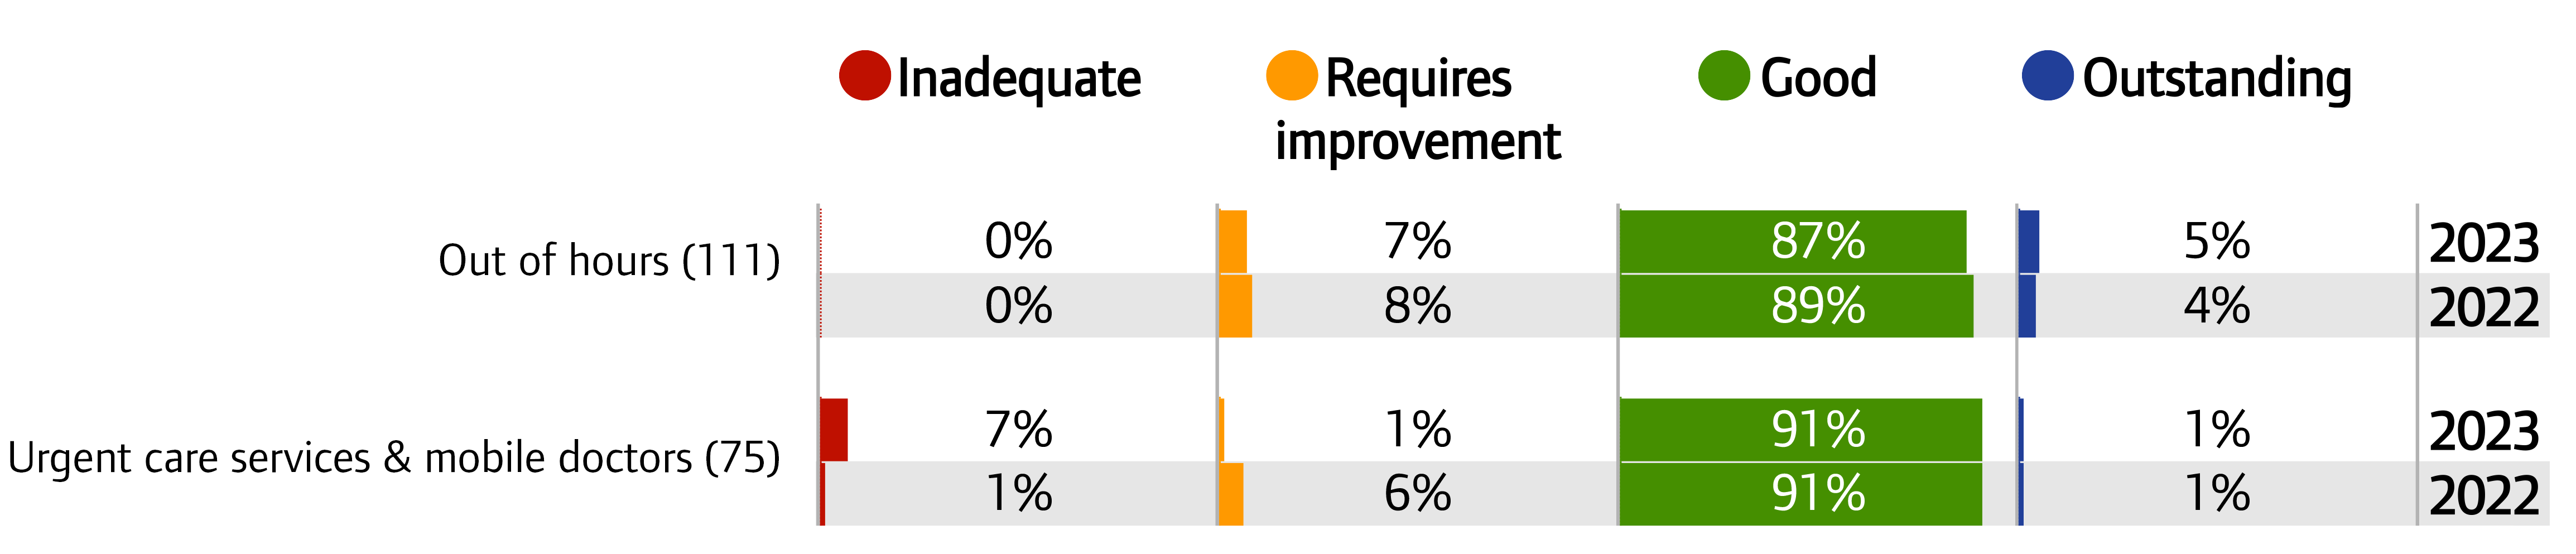
Figure A16: NHS ambulance trust, overall ratings, 2022 and 2023
Source: CQC ratings data, 31 July 2022 and 1 August 2023
Note: Percentages may not add to 100 due to rounding.
Figure A17: NHS ambulance trusts, key question ratings, 2022 and 2023
Source: CQC ratings data, 31 July 2022 and 1 August 2023
Note: Percentages may not add to 100 due to rounding.
Figure A18: Independent ambulance locations, overall ratings, 2022 and 2023
Source: CQC ratings data, 31 July 2022 and 1 August 2023
Note: Percentages may not add to 100 due to rounding.
Figure A19: Independent ambulance locations, key question ratings, 2022 and 2023
Source: CQC ratings data, 31 July 2022 and 1 August 2023
Note: Percentages may not add to 100 due to rounding. Percentages between 0.01% and 1% have been rounded up to 1%.
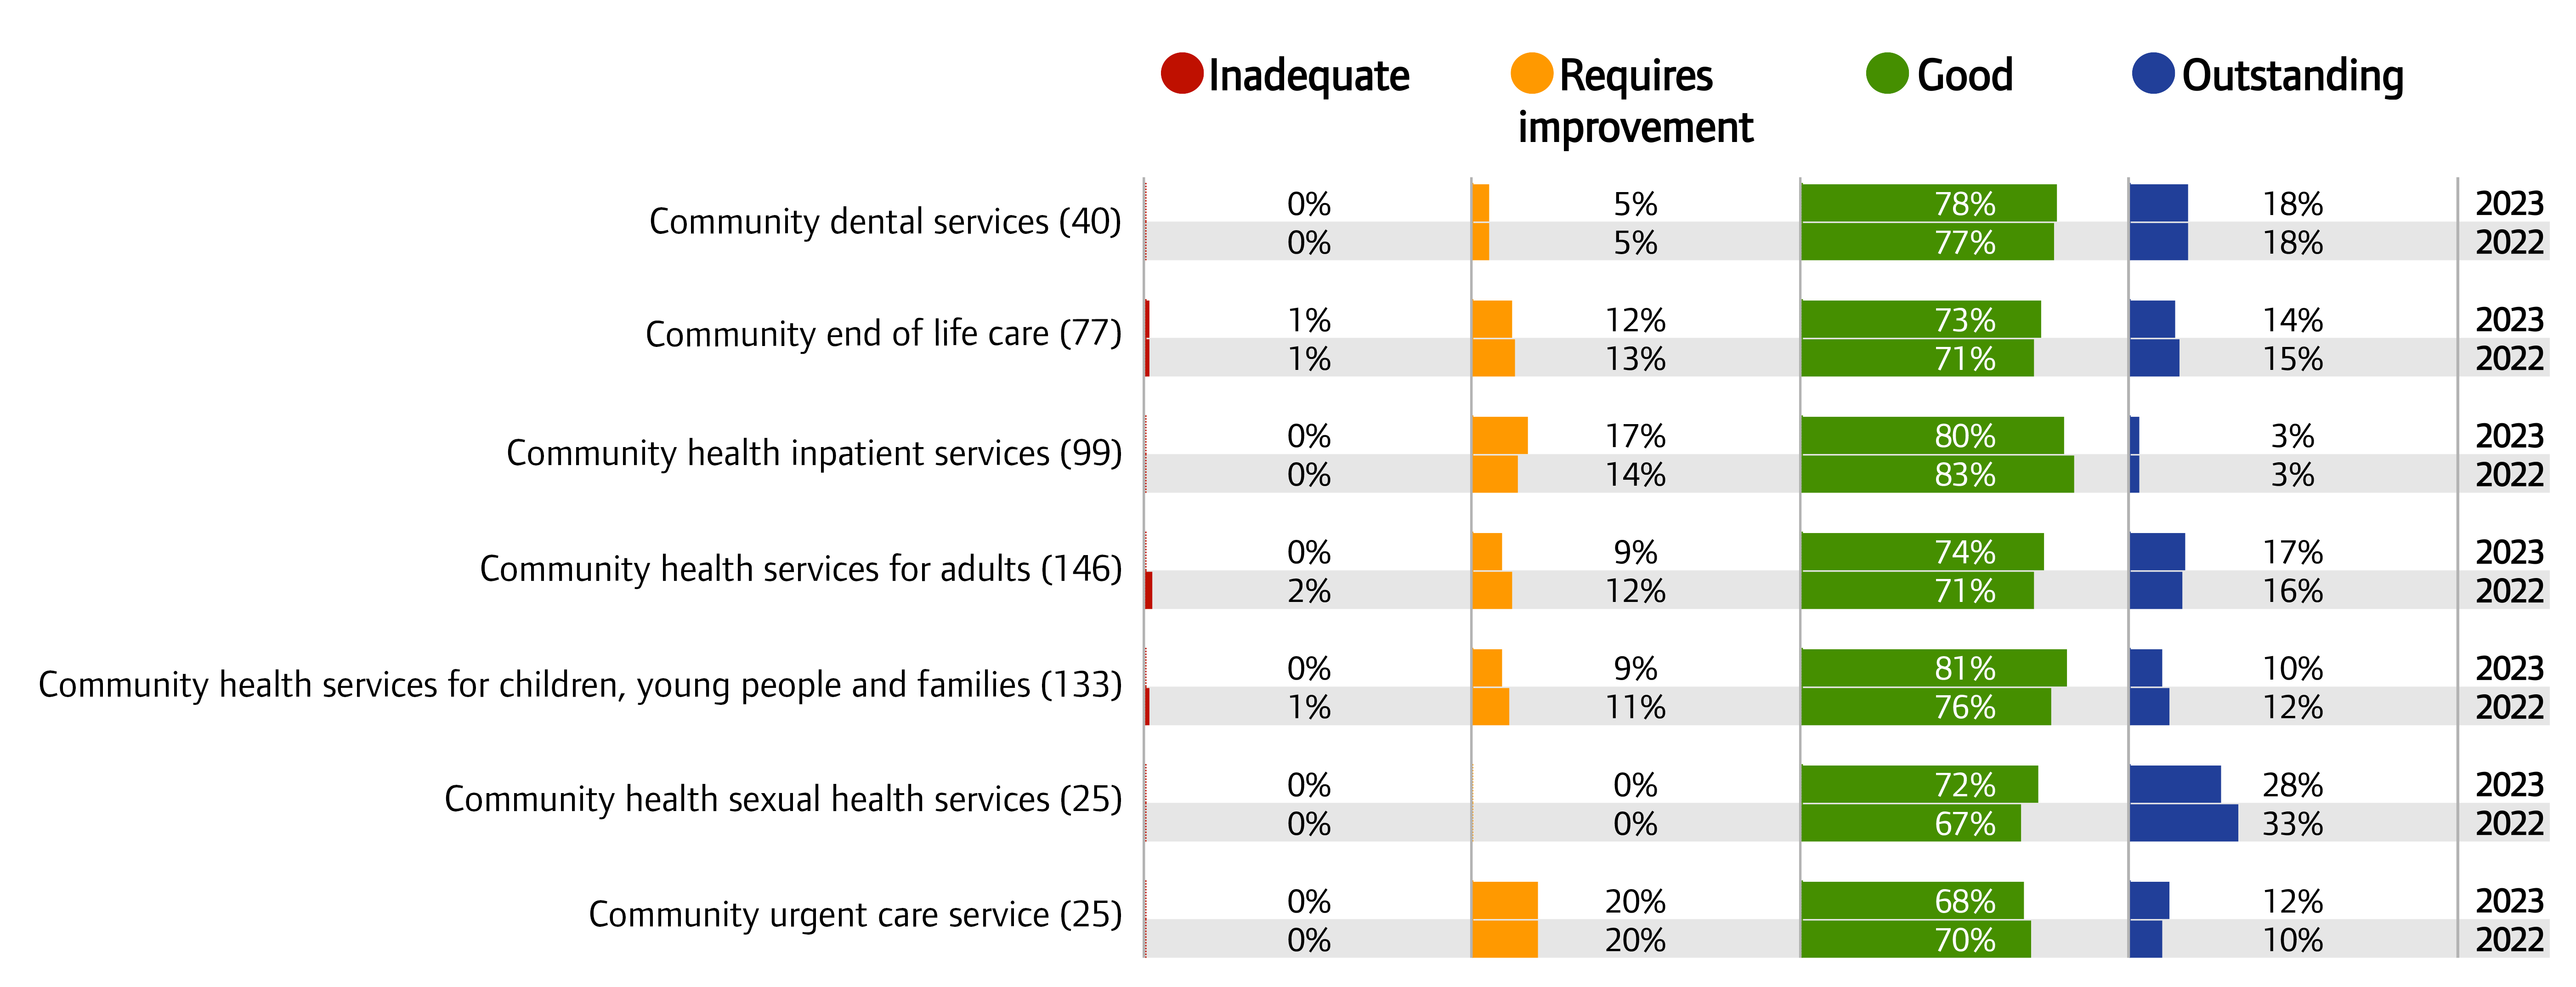
Figure A20: Community health core services in all settings, overall ratings, 2022 and 2023
Source: CQC ratings data, 31 July 2022 and 7 September 2023
Note: Percentages may not add to 100 due to rounding. Percentages between 0.01% and 1% have been rounded up to 1%.
Figure A21: Community health core services in all settings, key question ratings, 2022 and 2023
Source: CQC ratings data, 31 July 2022 and 7 September 2023
Note: Percentages may not add to 100 due to rounding. Percentages between 0.01% and 1% have been rounded up to 1%.
Figure A22: Community health core services in all settings, overall ratings, 2022 and 2023
Source: CQC ratings data, 31 July 2022 and 7 September 2023
Note: Percentages may not add to 100 due to rounding. Percentages between 0.01% and 1% have been rounded up to 1%.