New weekly outbreaks in care homes
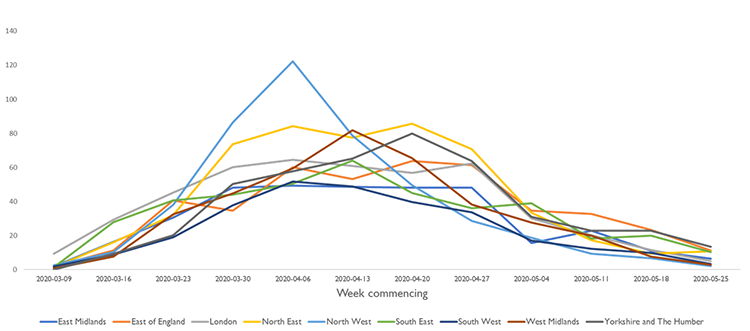
This chart shows the weekly progression of outbreaks in each region (per 1,000 care homes). Care homes are only counted once, when they first experience an outbreak.
Source: PHE Covid-19 Outbreaks in care homes, cumulative figures from 09/03/20 – 31/05/2020, published 4 June 2020
Care homes with outbreaks by region
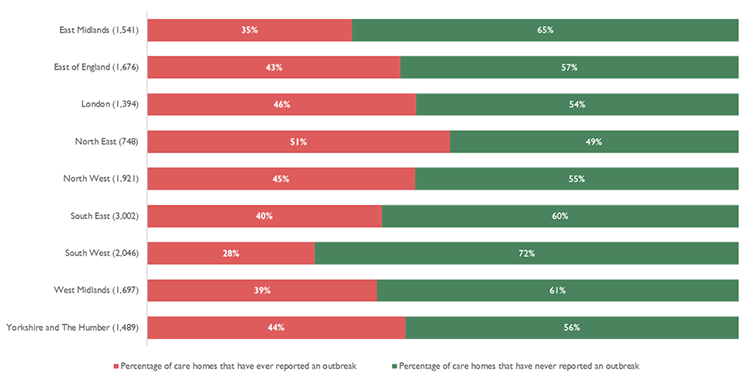
The figures in brackets show the number of care homes that PHE assign to each government region. All regions have increased by 2-7% since the last update. There are some very small differences with our own classification, this is likely to be as a result of new registration activity and/or service type descriptions.
Source: PHE Covid-19 Outbreaks in care homes, cumulative figures from 09/03/20 – 31/05/2020, published 4 June 2020
Homecare providers – prevalence of COVID-19
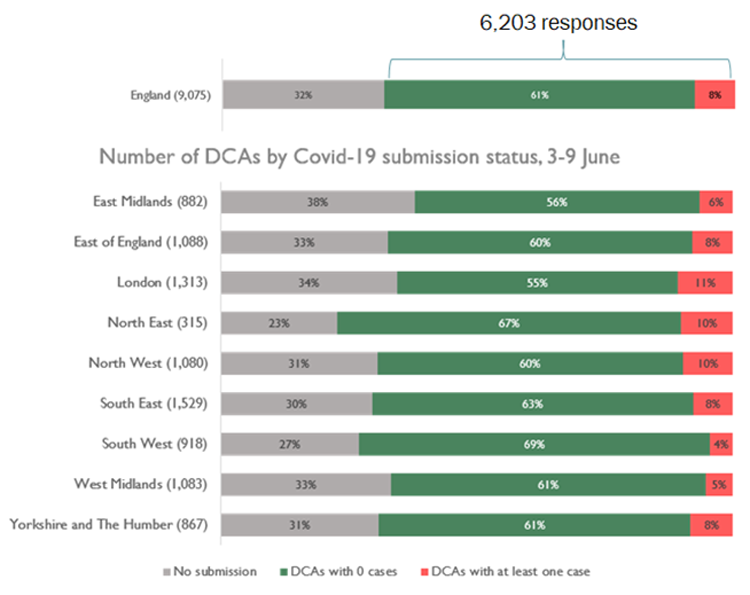
Source: CQC Domiciliary Care Agency Survey. Homecare providers with at least one case including suspected and confirmed cases. Numbers in brackets show number of services that are primarily homecare providers in the region. Included in these figures are homecare services currently lying dormant, so completion rates are slightly higher for fully active services than this might suggest. Percentages may not add to 100% due to rounding.
Homecare providers – availability of all PPE
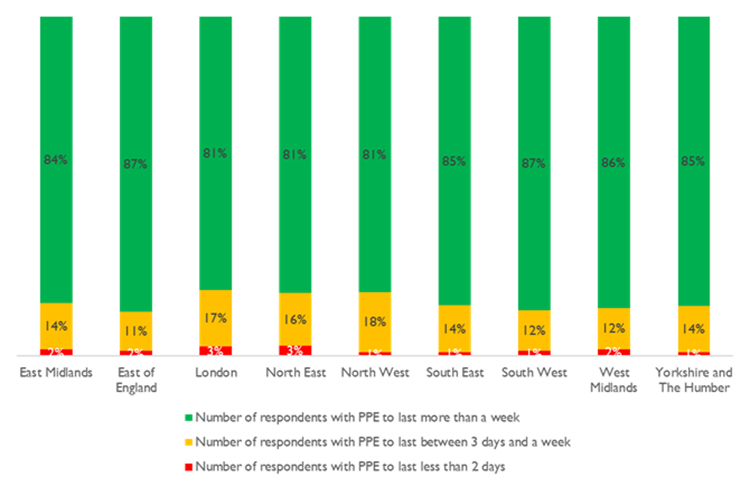
Source: CQC DCA Survey – latest response in period 3-9 June inclusive.
Homecare providers – staff absence
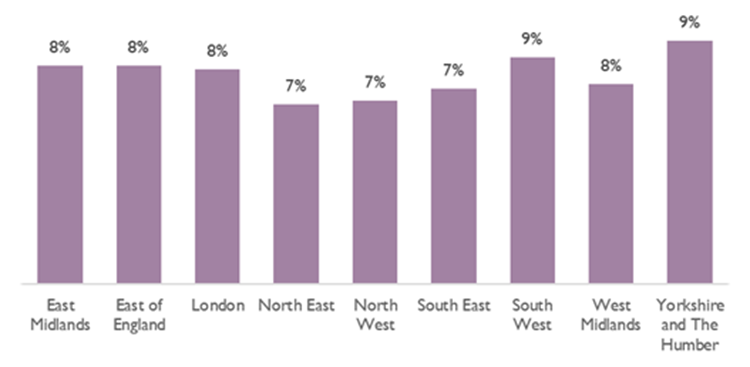
England average: 8%
Source: CQC Domiciliary Care Agency survey – latest response in period 3-9 June inclusive
* includes staff who are self-isolating or have care commitments
Deaths notified by care homes
The latest data, from 10 April – 5 June, continues to show that deaths in care homes due to COVID-19 are decreasing.
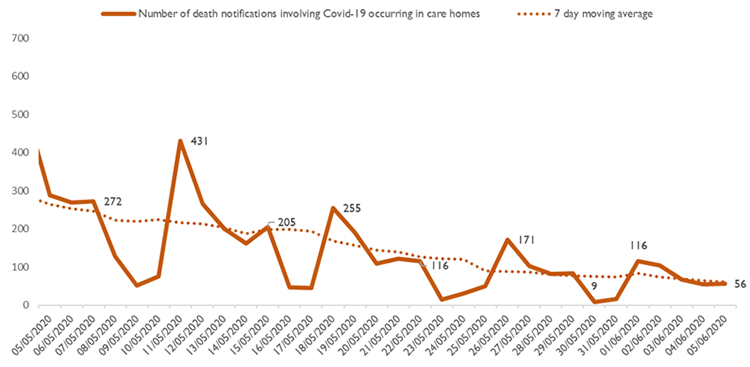
Source: CQC Death Notifications submitted 10 April to 5 June 2020
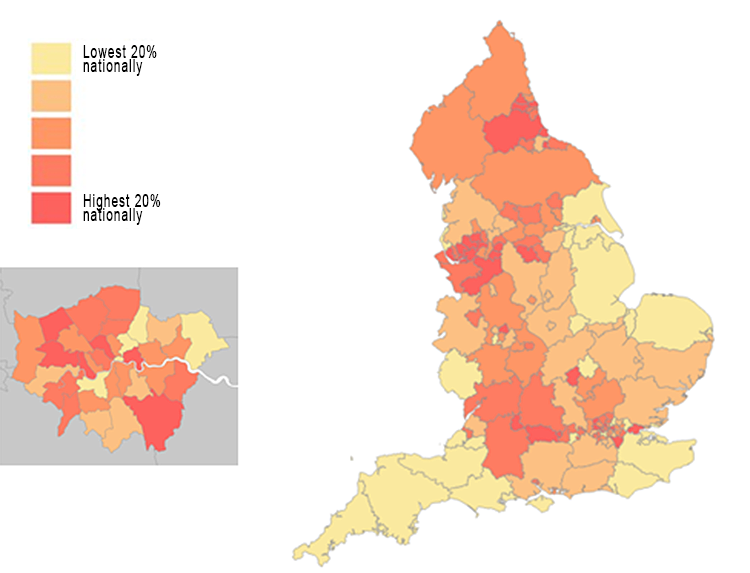
Source: CQC death of service user notifications from 10 April to 3 June 2020
For this map, notifications are of deaths no matter where the resident died, so it includes deaths in hospitals and hospices
Deaths of people detained under the Mental Health Act – by age and gender
| Age band | 18-24 | 25-34 | 35-44 | 45-54 | 55-64 | 65-74 | 75-84 | 85+ | Unknown | Total |
|---|---|---|---|---|---|---|---|---|---|---|
| Suspected or confirmed COVID-19 | 1 | 1 | 4 | 5 | 11 | 12 | 19 | 14 | 6 | 82 |
| Not COVID-19 | 3 | 6 | 4 | 13 | 17 | 16 | 12 | 5 | 11 | 85 |
| Total | 4 | 7 | 8 | 18 | 28 | 28 | 31 | 19 | 17 | 160 |
| Female | Male | Unknown | Total | |
|---|---|---|---|---|
| Suspected or confirmed COVID-19 | 22 | 52 | 8 | 82 |
| Not COVID-19 | 26 | 39 | 13 | 78 |
| Total | 48 | 91 | 21 | 160 |
Deaths of people with a learning disability notified by providers who told us they provide care for people with a learning disability and/or autism
| Age | 25-34 | 35-44 | 45-54 | 55-64 | 65-74 | 75-84 | 85+ | Unknown | Total | |
|---|---|---|---|---|---|---|---|---|---|---|
| 2019,not COVID-19 | * | 10 | 8 | 22 | 46 | 40 | 21 | 14 | 6 | 82 |
| 2020,suspectedand confirmed COVID-19 | * | 6 | 14 | 26 | 67 | 54 | 28 | 10 | 11 | 85 |
| 2020,not COVID-19 | * | 6 | 8 | 26 | 60 | 38 | 26 | 14 | 17 | 160 |
Proportion of deaths in adult social care services, by ethnic group
Note: the numbers at the top of the bars are the total counts of deaths due to suspected or confirmed COVID-19 in that ethnic group in the relevant settings, where stated for that group and where analysable – see the second chapter of the report for more information on the limitations of the data. The percentages at the bottom of the bars are the proportion of deaths that were due to suspected or confirmed COVID-19 in that ethnic group in the relevant settings.
ONS data on all weekly deaths in England (COVID and non-COVID) compared with the average for 2015-2019
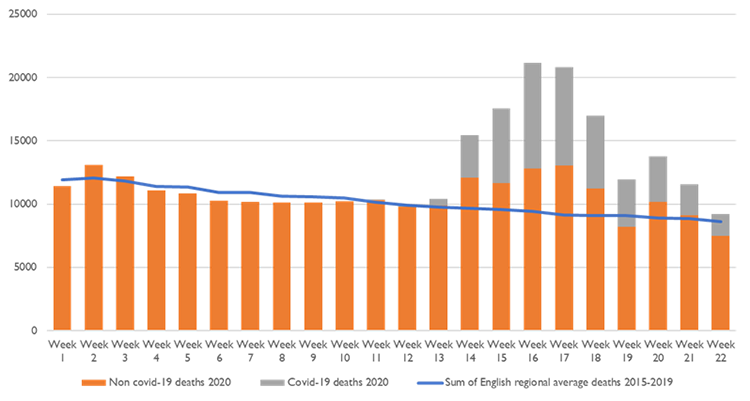
Source: Covid/Non-Covid 2020 death data and 2015-2019 death data. Week 22: week ending 29 May 2020.
Data notes
Chapter 1: For this report we carried out an initial review of feedback and local support plans from 18 out of 33 representatives, covering local stakeholder organisations from hospitals, primary care and adult social care.
Chapter 2: The data on deaths of people with a learning disability is the most accurate data we are able to produce at this point but it has a number of limitations:
- It is not mandatory for providers to tell us if someone has a learning disability when submitting a death notification.
- We could not extract detailed data, including whether or not the person who died had a learning disability, from a small number (around 4%) of the forms we included in this analysis due to the way the information was provided to us – i.e. illegible handwritten forms.
- Despite removing a large number of duplicates from this data, we cannot guarantee that every duplicate has been removed.
- It does not account for those detained under the Mental Health Act – see slides 15 and 29.
Sources
Deaths data: Office for National Statistics and CQC supplied to ONS.
Homecare provider PPE, COVID status and staffing data: CQC Domiciliary Care Agency survey.
Outbreaks data: Public Health England.
The data date ranges are shown. Data is contemporaneous where possible; most figures refer to the same week, or are counted to the end of that week.