Deaths notified by care homes
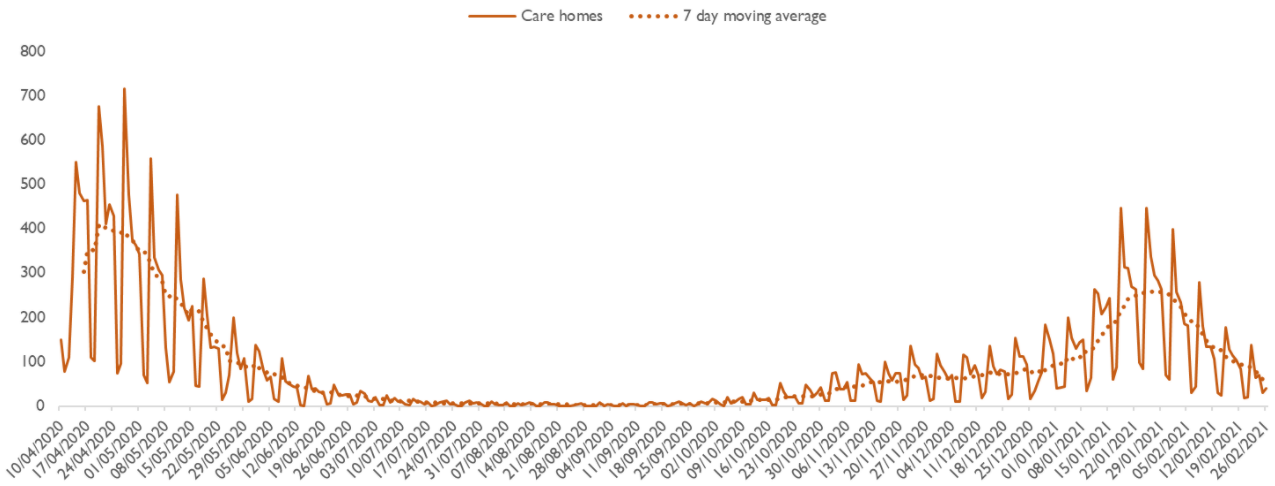
Source: CQC death notifications submitted 10/04/2020 to 26/02/2021. Note: The notifications only include those received by 4pm on Friday, 26 February 2021.
The chart shows the number of death notifications of people in care homes flagged with COVID-19 submitted each day up to 26 February 2021, with a seven-day moving average line showing the smoothed trend. The numbers of deaths appears to have peaked in mid-January and have been steadily falling since then.
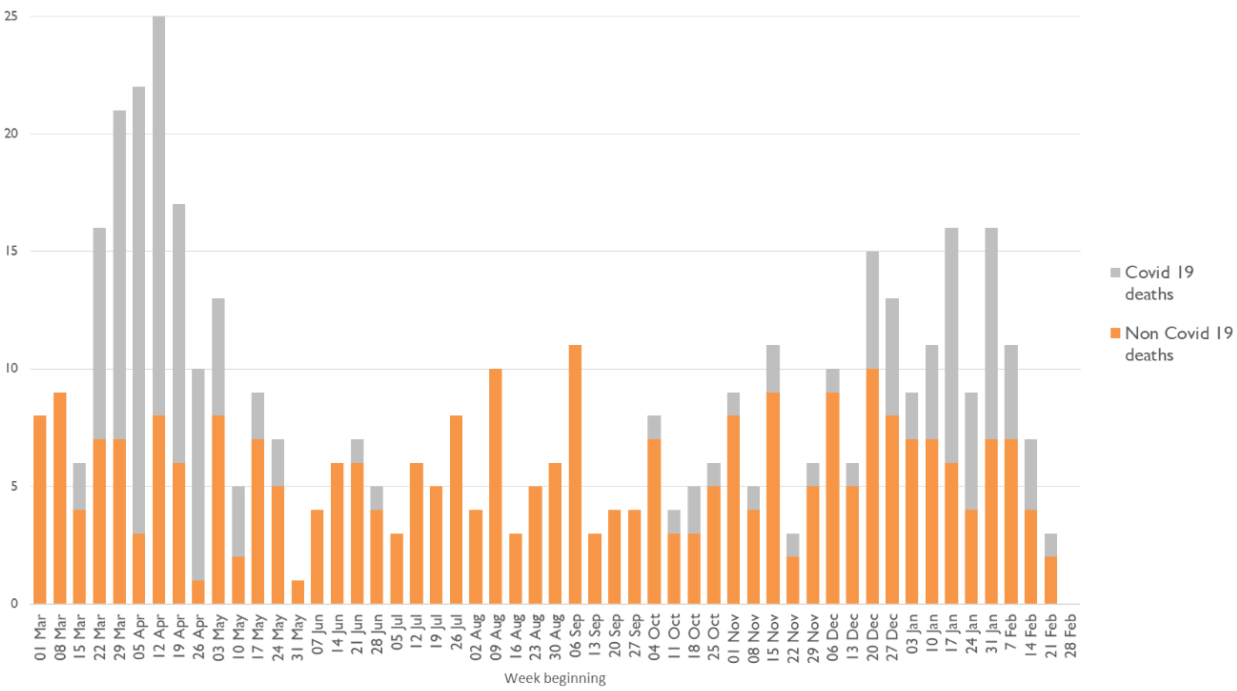
Deaths of people detained under the Mental Health Act
All providers registered with CQC must notify us about deaths of people who are detained, or liable to be detained, under the MHA.* From 1 March 2020 to 5 March 2021, we have been notified of 159 deaths that mental health providers indicated were suspected or confirmed to be related to COVID-19 (an increase of 15 since we reported in February). A further seven COVID-19 related deaths of detained patients were reported by other (non-mental health) providers (no increase since we last reported).**
* Includes detained patients on leave of absence, or absent without leave, from hospital, and conditionally discharged patients. ‘Detained patients’ also includes patients subject to holding powers such as s. 4, 5, 135 or 136, and patients recalled to hospital from CTO. These counts may also include notifications about the deaths of people subject to the MHA who are in the community and not in hospital.
** Data on notifications may be updated over time and therefore successive extracts may lead to changes in overall numbers unrelated to new cases.
The chart shows the number of deaths by week of death.
Of the 458 notifications from mental health providers in the 2020/21 period (covering all causes of death from 1 March 2020 to 5 March 2021), 360 were from NHS organisations, of which 121 deaths were indicated as being COVID-19-related, and 98 were from independent providers, of which 38 deaths were COVID-19-related.
We have identified 28 detained patients whose deaths have been notified to us from 1 March 2020 to 5 March 2021 who had a learning disability and/or were autistic: the majority (17) were not identified as related to confirmed or suspected COVID-19. Of these people, most also had a mental health diagnosis. Please note that these patients were identified both from a specific box being ticked on the notification form and a review of diagnoses in the free text of the form.
| Age band | 16-17 | 18-24 | 25-34 | 35-44 | 45-54 | 55-64 | 65-74 | 75-84 | 85+ | Unknown | Total |
|---|---|---|---|---|---|---|---|---|---|---|---|
| Suspected or confirmed COVID-19 | 0 | 1 | 4 | 8 | 11 | 28 | 35 | 46 | 22 | 11 | 166 |
| Not COVID-19 | 1 | 13 | 30 | 27 | 40 | 53 | 53 | 49 | 18 | 40 | 324 |
| Total | 1 | 14 | 34 | 35 | 51 | 81 | 88 | 95 | 40 | 51 | 490 |
| Gender | Female | Male | Unknown or unspecified | Total |
|---|---|---|---|---|
| Suspected or confirmed COVID-19 | 55 | 98 | 13 | 166 |
| Not COVID-19 | 98 | 182 | 44 | 324 |
| Total | 153 | 280 | 57 | 490 |
| Ethnicity | Suspected or confirmed COVID-19 | Not COVID-19 |
|---|---|---|
| Asian | 7 | 7 |
| Black | 19 | 26 |
| Mixed | 4 | 5 |
| Other ethnic groups | 1 | 3 |
| White | 94 | 195 |
| Unknown | 32 | 76 |
| Not stated | 9 | 12 |
| Total | 166 | 324 |
| Place of death | Suspected or confirmed COVID-19 | Not COVID-19 |
|---|---|---|
| Medical ward | 112 | 100 |
| Psychiatric ward | 39 | 104 |
| Hospital grounds | 1 | 6 |
| Patient’s home | 0 | 28 |
| Public place | 0 | 6 |
| Other | 3 | 41 |
| Not stated | 11 | 39 |
| Total | 166 | 324 |
All weekly deaths in England (COVID and non-COVID)
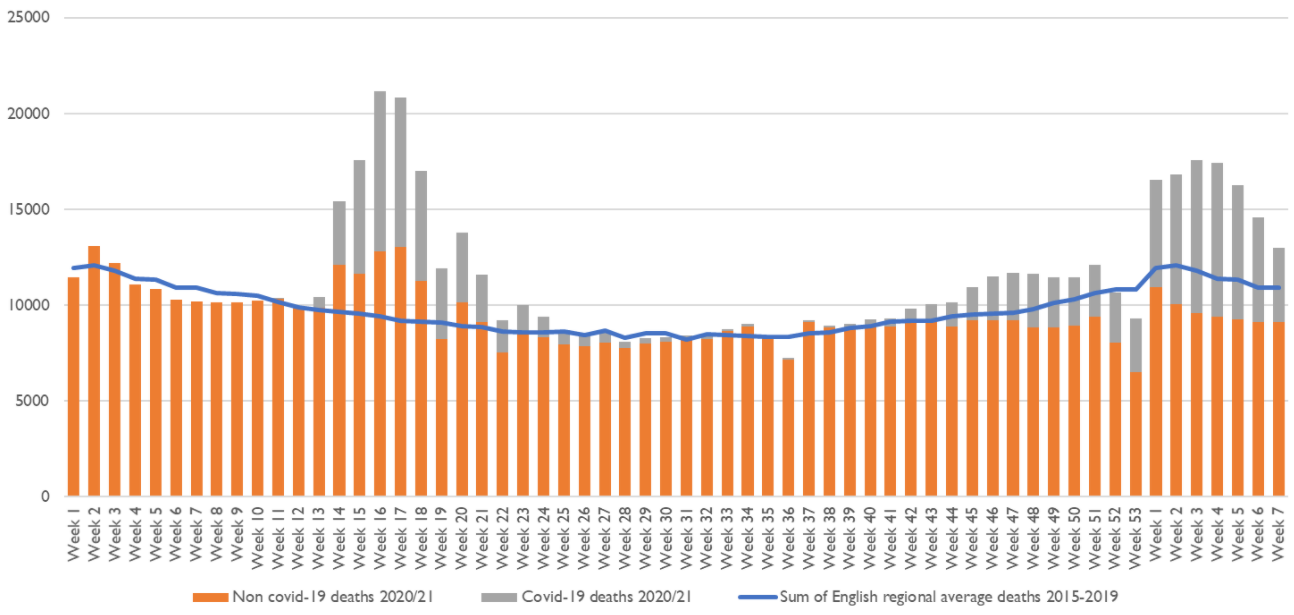
Source: ONS COVID/non-COVID 2020 and 2021 death data and 2015-2019 death data. Week 7, 2021: week ending 26 February 2021.