In June 2020 we expressed concern that the combined effect of the COVID pandemic with seasonal winter pressures would cause severe challenges for urgent and emergency care. In this section, we look at the evidence so far about how services have been affected by the pandemic during this winter, and discuss what action CQC is taking to provide constructive support.
What does the data tell us about winter pressures this year?
Figure 1 shows how atypical monthly attendances at emergency departments have been since the start of the pandemic, when the numbers immediately plunged in April to levels not seen for many years. These numbers started to recover from May, but peaked in August before falling again throughout the autumn, resulting in the number of attendances in January 2021 being 27% lower than the five-year average for January.
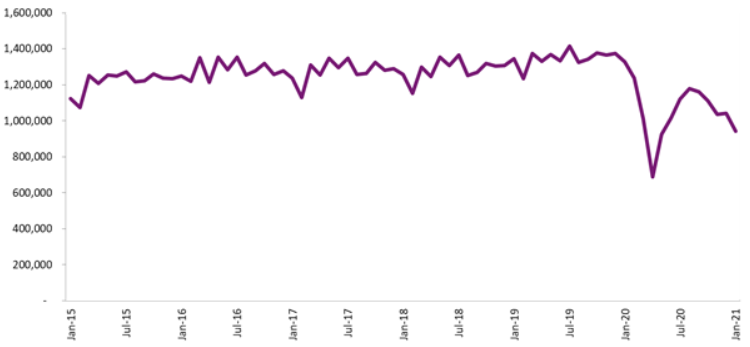
Source: NHS England, A&E attendances and emergency admissions statistics
Despite this lower level of activity, performance against the four-hour target, which rose in April to monthly levels not seen since mid-2015, has fallen sharply since then (figure 2). In January, 70% of people attending type 1 emergency departments spent less than four hours from arrival to admission, discharge or transfer elsewhere. This is lower than any month in recent years, except December 2019. There are challenges particular to the pandemic that are compounding the problems faced by trusts this year, such as the need to manage the emergency department environment in line with physical distancing requirements.
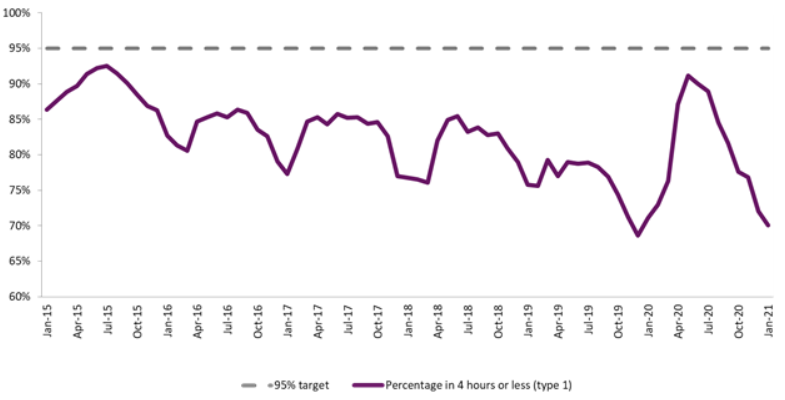
Source: NHS England, A&E attendances and emergency admissions statistics
Of those who attended type 1 emergency departments, the proportion who were admitted to hospital peaked at 37% in April 2020 (affected by the sharp fall in the overall number of people attending). Since then, the proportion fell during the summer in line with the pattern seen in previous years, before then rising again throughout the autumn (figure 3). This suggests that, while attendances remain depressed, the acuity of those attending is rising.
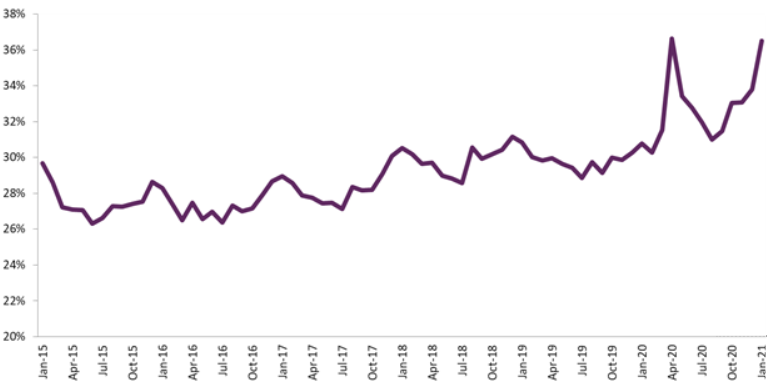
Source: NHS England, A&E attendances and emergency admissions statistics
Still focusing on people who attended emergency departments and were then admitted, there has been a very sharp rise in the number of people who had to wait more than 12 hours to be admitted (figure 4).
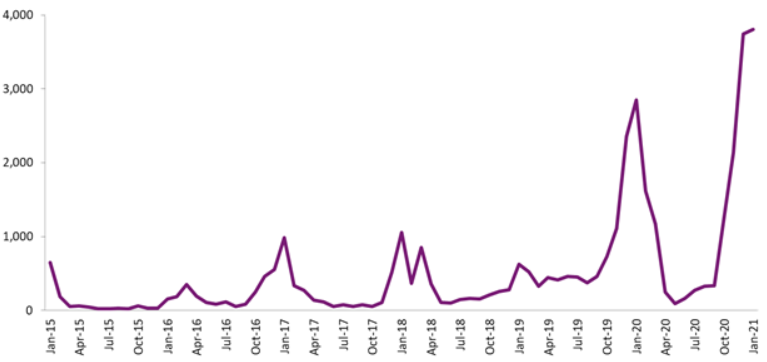
Source: NHS England, A&E attendances and emergency admissions statistics
The numbers of people experiencing such long waits has consistently peaked each winter, but 2019/20 and the current winter have seen numbers far higher than previously, reaching 3,745 in December 2020. This equated to just under 1% of all those who were admitted in December.
The data above shows that, although overall numbers of people attending emergency departments have remained lower than in recent years, services have faced challenges in managing the flow of people, including admitting patients in a timely manner where admission is required. Very high numbers of beds occupied by patients with COVID-19 over December and January will have been a major factor in this, as well as the challenge of managing services safely (including physical distancing and other stringent infection control measures) within confined environments.
One impact of this is that people are being held in ambulances outside emergency departments, known as ‘handover delays’. Figure 5 compares the number of delays over 60 minutes each day nationally this winter (2020/21) with last winter (2019/20). The overall numbers are broadly similar, but it is important to recognise that the data only measures how many delays that breached 60 minutes, and not the total length of each delay. We are hearing about frequent instances of patients waiting as long as eight hours in ambulances outside emergency departments. This is a poor experience for patients, as well as having a major impact on the availability of ambulances and their crews to respond to the next case.
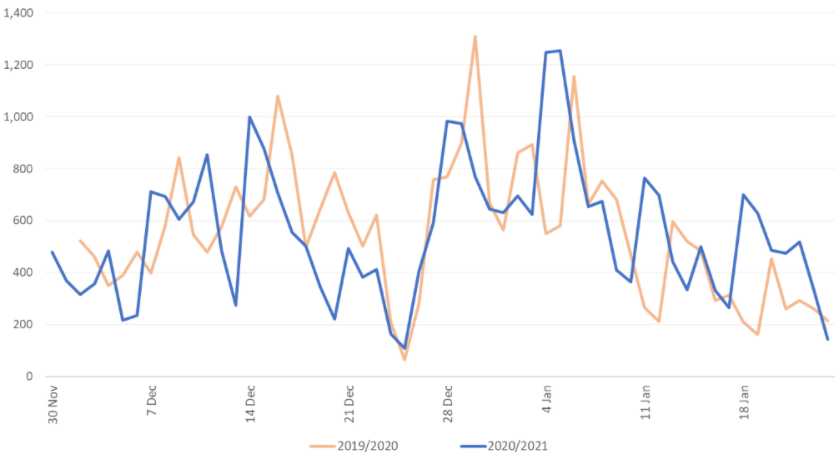
Source: NHS England and NHS Improvement – Daily Hospital Situation Reports (number of patients arriving by ambulance and ambulance handover delays)
The total number of ambulance arrivals from the start of December to 24 January this year is approximately 10% lower than the same period last year. Figure 6 shows the number of delays over 60 minutes as a percentage of ambulance arrivals – the average for the latest period is 4.4% compared with 3.9% last year, so a slight rise.
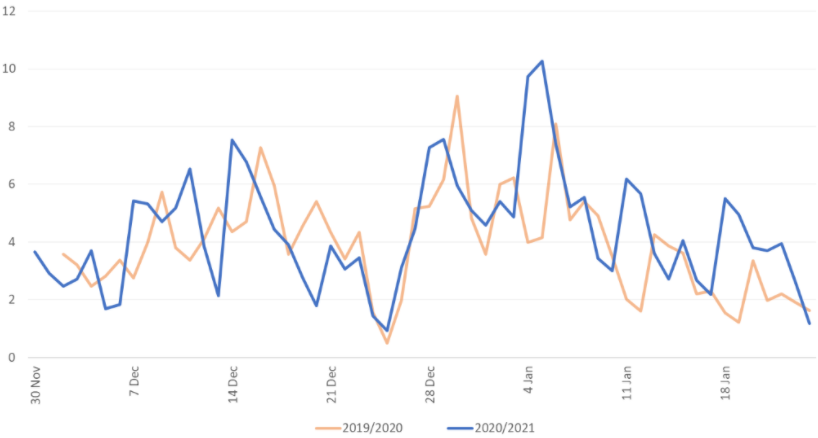
Source: NHS England and NHS Improvement – Daily Hospital Situation Reports (number of patients arriving by ambulance and ambulance handover delays)
Where we do see more variation, however, is between the regions. Figure 7 shows that:
- The East of England, London and Midlands regions all follow a similar pattern to England, in showing a broadly similar trend this year compared with last year
- In the North East and Yorkshire and North West regions, there has been a markedly lower percentage of ambulance arrivals resulting in handover delays of at least 60 minutes
- In the South East and South West regions there has been an increase this year.
The variation is the same if viewed as absolute numbers of delays, so is not related to a variation in numbers of ambulance arrivals between regions. Figure 7 is presented as percentages of arrivals to account for different sizes and levels of activity between regions.
We can also see a distinct variation in the proportion of arrivals tending to result in delays of over 60 minutes, with the highest proportions in East of England and the Midlands, and much lower proportions in North East and Yorkshire and the North West.
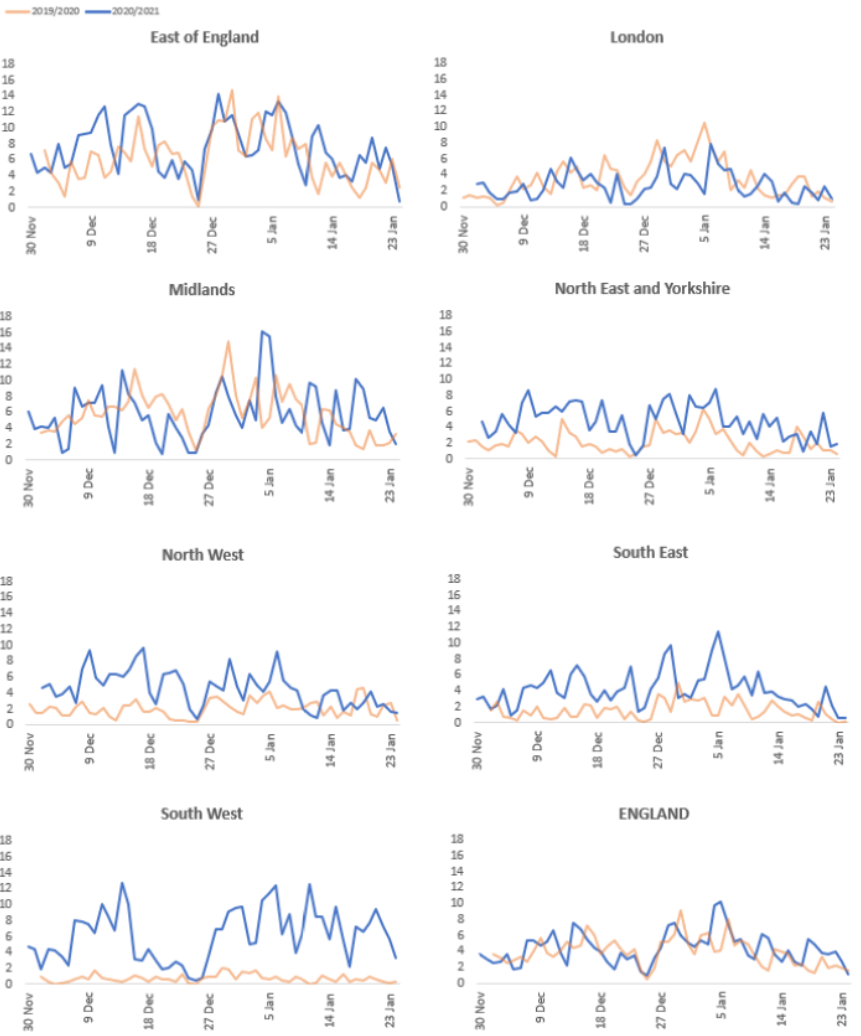
Source: NHS England and NHS Improvement – Daily Hospital Situation Reports (number of patients arriving by ambulance and ambulance handover delays)
As mentioned above, what this data is unable to tell us is the length of each delay beyond 60 minutes. We are aware that there have been some very long delays occurring this winter, but it is not possible to identify from the data whether the numbers of extremely long delays (such as those greater than five hours) has increased since last winter.
Working in partnership with clinicians to maintain safe care
Since April 2020, we have been working with frontline clinicians from emergency departments throughout the country to understand the pressures they have faced and what action services could take to mitigate risk and maintain safe care when under such exceptional pressure.
This led to the publication of the Patient FIRST framework in October 2020. The framework was developed in partnership with the clinicians as a tool to help support those working in NHS trusts and the wider health and care system to understand what lessons can be learnt from the impact of the pandemic, and what good practice can be harnessed to support improvement.
It contains a number of practical examples of actions that can be taken at a departmental, trust and wider system level to maximise capacity, maintain effective patient flow, and keep staff and patients safe. FIRST stands for:
- Flow
- Infection control (including social distancing)
- Reduced patients in emergency departments
- Staffing
- Treatment in the emergency department.
During autumn 2020, our programme of Provider Collaboration Reviews examined how providers were working together in urgent and emergency care. As part of this work, we published the briefing ‘Collaboration in urgent and emergency care’, which includes good practice examples from different parts of the urgent and emergency care system, showcasing how some services have taken steps to put them in a better position to withstand the current challenges, including the double impact of ‘normal’ winter pressures and the pandemic.
During October and early November we applied our ‘transitional regulatory approach’, through which our inspectors have held discussions with executive directors of trusts with major emergency departments, including those with stand-alone paediatric emergency departments. These calls provided the opportunity for trusts to demonstrate how they have prepared for the winter months, including how they have provided executive level support to the emergency department and patient flow through the hospital.
The discussions are structured around our key questions of safe, responsive and well-led, and cover the following key lines of enquiry:
Safe
- How do systems, processes and practices keep people safe and safeguarded from abuse?
- How are risks to people assessed, and their safety monitored and managed, so they are supported to stay safe?
Responsive
- Do services take account of the particular needs and choices of different people?
- Can people access care and treatment in a timely way?
Well-led
- Is there leadership capacity and capability to deliver high-quality, sustainable care?
- Is there a culture of high-quality, sustainable care?
- Are there clear responsibilities, roles and systems of accountability to support good governance and management?
- Are there clear and effective processes for managing risks, issues and performance?
- Are the people who use services, the public, staff and external partners engaged and involved to support high-quality sustainable services?
- Are there robust systems and processes for learning, continuous improvement and innovation?
Among the areas outlined above, those which flagged the greatest risk were questions 2 and 4 in the list above, and those which flagged the lowest risk were questions 6 and 10.
As in previous winters, we have been monitoring key performance metrics at NHS trust level which has helped to flag where services may be facing the greatest challenges, making use of the winter situation reports data published by NHS England.
Informed by the transitional regulatory approach process, the monitoring of situation reports data outlined above, and intelligence from local inspections teams, a number of emergency departments have been identified for inspection, with visits taking place throughout the winter.
Reports on these inspections will be published over the next few weeks, but so far we have found that the issues and challenges facing services are similar to those experienced in previous years, albeit exacerbated by the pandemic. The key factors affecting services’ ability to provide a good standard of care include:
- the capacity to manage the flow of people through the system, from ambulance handover delays to hospital admissions
- staffing shortages exacerbated by high numbers of people off sick or isolating due to COVID-19.
Effective local leadership and active support for the emergency department from the hospital and wider system remain essential for managing the pressures well.