Designated settings scheme
We continue to work with the Department of Health and Social Care, local authorities and individual care providers to provide assurance of safe and high-quality care in designated settings, which are part of a scheme to allow people with a COVID-positive test result to be discharged safely from hospitals who will be moving or going back into a care home setting. Our website has a weekly update on the number of assured designated locations.
As of 4 February, there were 156 assured designated settings within 109 local authorities. Some local authorities have chosen not to participate in the scheme, and in some areas they have agreed with local NHS partners to make use of NHS settings to fulfil the role of a designated setting. There are currently 40 settings of this alternative type.
In previous issues, we have looked at the regional data we have on designated settings. The chart below shows the latest regional picture up to 2 February 2021, set against rates of acute bed occupancy by people with COVID-19.
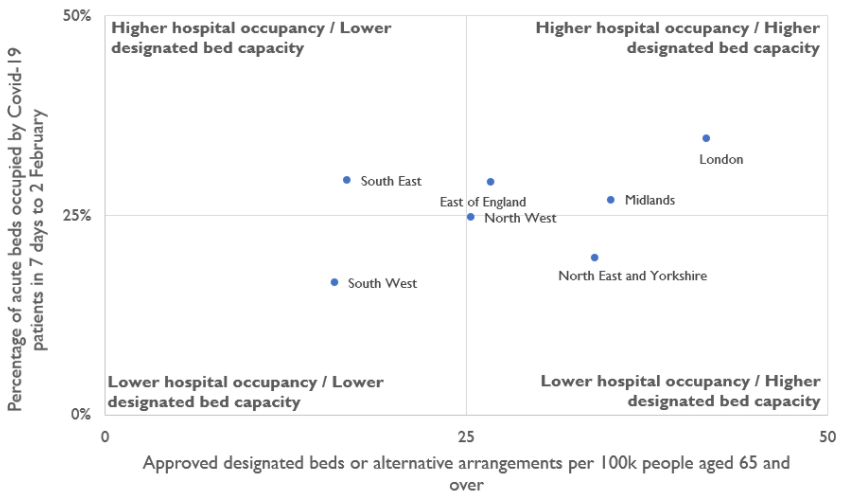
- The South East remained under pressure, with high rates of COVID bed occupancy and lower numbers of designated beds to discharge COVID positive people to
- The South West had seen increases in designated beds since the previous week. The total designated beds grew from 135 to 199
- London, the North West and the South West had higher occupancies in approved designated settings locations. However, London and the South West also had a higher proportion of alternative arrangement beds, which may reduce the reliance on designated settings alone.
Deaths notified by care homes
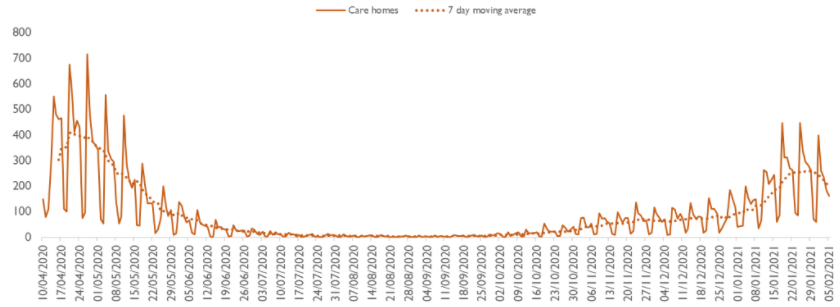
Source: CQC death notifications submitted 10 April 2020 to 5 February 2021. Note: The notifications only include those received by 4pm on Friday, 5 February 2021.
The chart shows the number of death notifications of people in care homes flagged with COVID-19 submitted each day up to 4 February 2021, with a seven day moving average line showing the smoothed trend. The numbers of deaths appears to have peaked in mid January and to have begun falling since then, although it remains higher than at any time between late May and late December 2020.
Deaths of people detained under the Mental Health Act
All providers registered with CQC must notify us about deaths of people who are detained, or liable to be detained, under the MHA.* From 1 March 2020 to 5 February 2021, we have been notified of 144 deaths that mental health providers indicated were suspected or confirmed to be related to COVID-19 (an increase of seven since we reported in December). A further seven COVID-19 related deaths of detained patients were reported by other (non-mental health) providers (an increase of two since we last reported).**
*Includes detained patients on leave of absence, or absent without leave, from hospital, and conditionally discharged patients. ‘Detained patients’ also includes patients subject to holding powers such as s. 4, 5, 135 or 136, and patients recalled to hospital from CTO. These counts may also include notifications about the deaths of people subject to the MHA who are in the community and not in hospital.
**Data on notifications may be updated over time and therefore successive extracts may lead to changes in overall numbers unrelated to new cases.
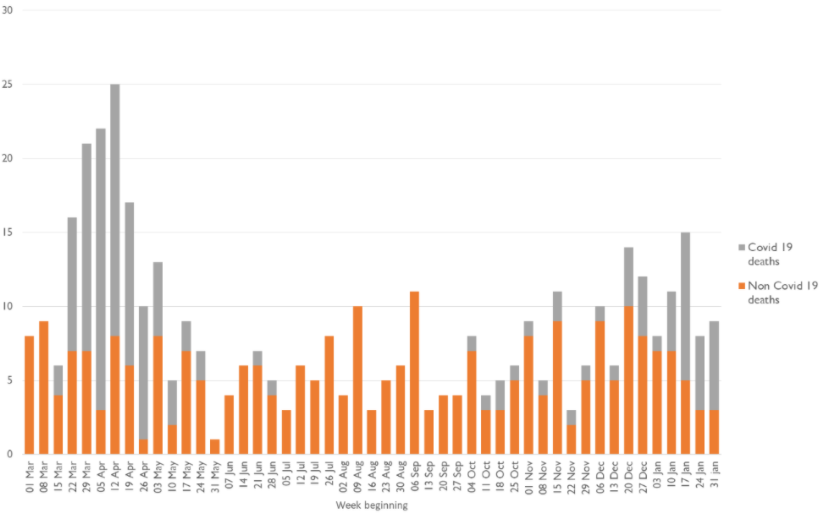
The chart shows the number of deaths by week of death.
Of the 426 notifications from mental health providers in the 2020/21 period (covering all causes of death from 1 March 2020 to 5 February 2021), 335 were from NHS organisations, of which 109 deaths were indicated as being COVID-19-related, and 91 were from independent providers, of which 35 deaths were COVID-19-related.
We have identified 20 detained patients whose deaths have been notified to us from 1 March to 5 February 2021 who had a learning disability and/or were autistic: the majority (13) were not identified as related to confirmed or suspected COVID-19. Of these people, most also had a mental health diagnosis. Please note that these patients were identified both from a specific box being ticked on the notification form and a review of diagnoses in the free text of the form.
| Age band | 16-17 | 18-24 | 25-34 | 35-44 | 45-54 | 55-64 | 65-74 | 75-84 | 85+ | Unknown | Total |
|---|---|---|---|---|---|---|---|---|---|---|---|
| Suspected or confirmed COVID-19 | 1 | 1 | 7 | 9 | 23 | 31 | 39 | 22 | 18 | 151 | |
| Not COVID-19 | 1 | 13 | 27 | 25 | 37 | 52 | 47 | 47 | 16 | 38 | 303 |
| Total | 1 | 14 | 28 | 32 | 46 | 75 | 78 | 86 | 38 | 56 | 454 |
| Gender | Female | Male | Unknown or unspecified | Total |
|---|---|---|---|---|
| Suspected or confirmed COVID-19 | 51 | 87 | 13 | 151 |
| Not COVID-19 | 87 | 173 | 43 | 303 |
| Total | 138 | 260 | 56 | 454 |
| Ethnicity | Suspected or confirmed COVID-19 | Not COVID-19 |
|---|---|---|
| Asian | 5 | 7 |
| Black | 16 | 25 |
| Mixed | 4 | 5 |
| Other ethnic groups | 1 | 3 |
| White | 87 | 182 |
| Unknown | 32 | 70 |
| Not stated | 6 | 11 |
| Total | 151 | 303 |
| Place of death | Suspected or confirmed COVID-19 | Not COVID-19 |
|---|---|---|
| Medical ward | 99 | 94 |
| Psychiatric ward | 38 | 96 |
| Hospital grounds | 1 | 6 |
| Patient’s home | 0 | 26 |
| Public place | 0 | 6 |
| Other | 3 | 38 |
| Not stated | 10 | 37 |
| Total | 151 | 303 |
ONS data on all weekly deaths in England (COVID and non-COVID) compared with the average for 2015-2019
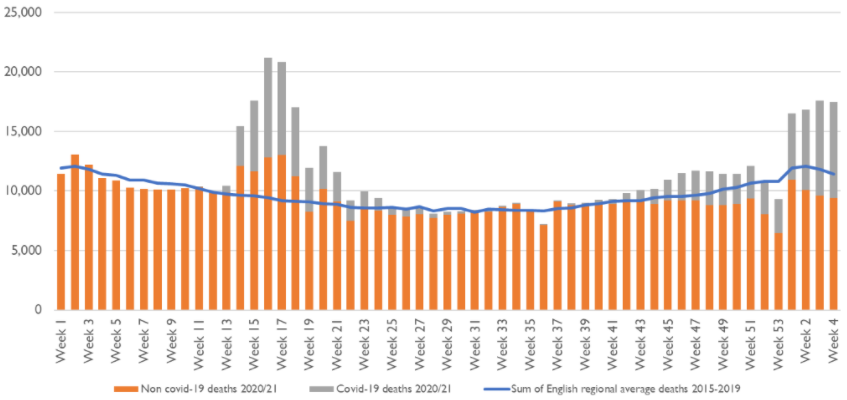
Source: ONS COVID/non-COVID 2020 and 2021 death data and 2015-2019 death data. Week 4, 2021: week ending 29 January 2021.