Homecare providers - prevalence of COVID-19
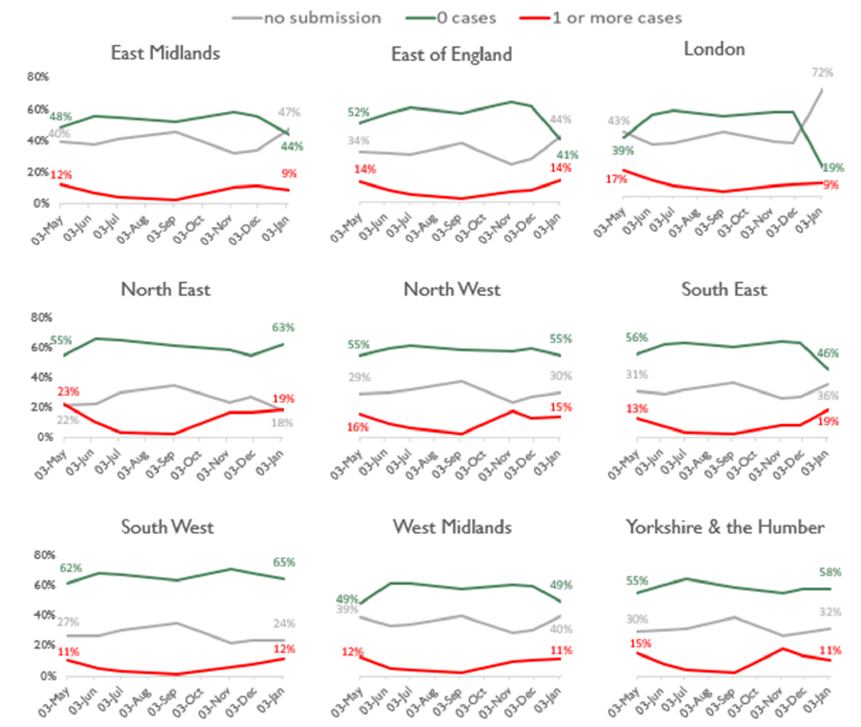
Source: CQC Domiciliary Care Agency Survey, data extracts from 3 May 2020 to 3 January 2021.
Homecare providers with at least one case include suspected AND confirmed cases. Included in these figures are homecare services currently lying dormant, so completion rates are slightly higher for fully active services than this might suggest. Percentages may not add to 100% due to rounding.
Homecare providers – availability of all PPE
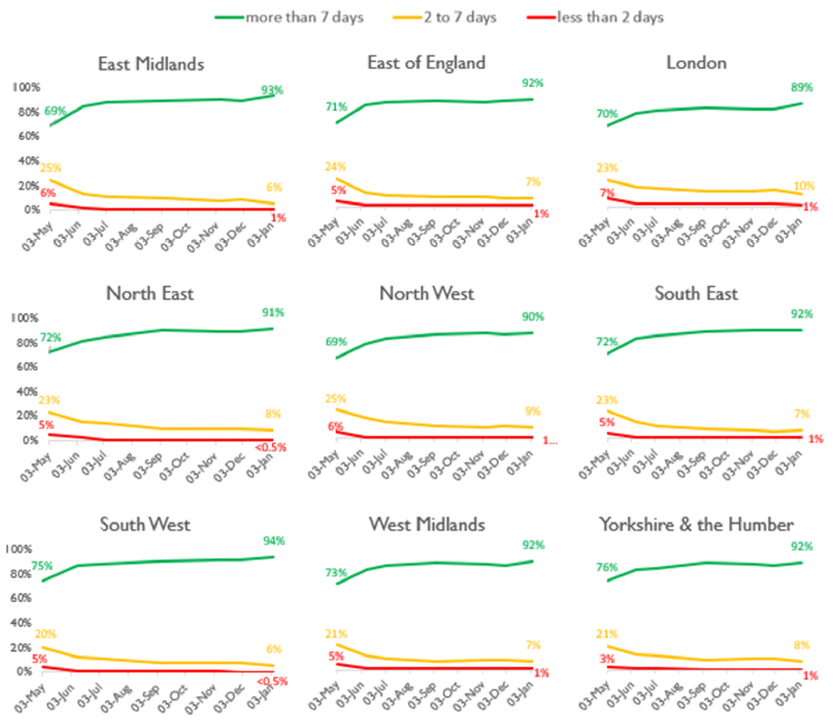
Source: CQC Domiciliary Care Agency survey – data extracts from 3 May 2020 to 3 January 2021.
Homecare providers – staff absence
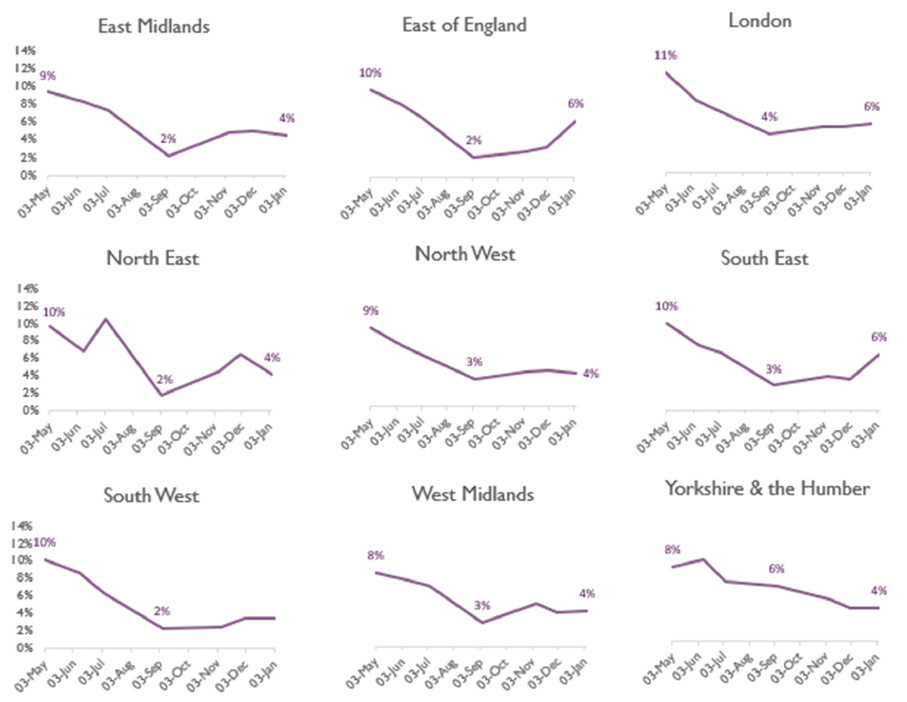
Source: CQC Domiciliary Care Agency survey, data extracts from 3 May 2020 to 3 January 2021. Includes staff who are self-isolating or have care commitments.
Deaths notified by care homes
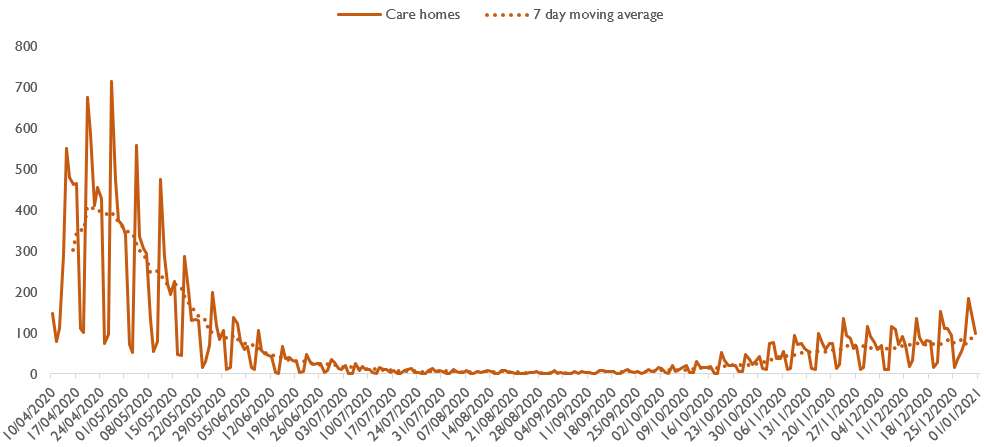
Note: The notifications only include those received by 4pm on Thursday 31st December 2020.
Deaths of people detained under the Mental Health Act
All providers registered with CQC must notify us about deaths of people who are detained, or liable to be detained, under the MHA. From 1 March 2020 to 1 January 2021, we have been notified of 113 deaths that mental health providers indicated were suspected or confirmed to be related to COVID-19 (an increase of seven since we reported in December). A further five COVID-19 related deaths of detained patients were reported by other (non-mental health) providers (no increase since we last reported).
This data includes detained patients on leave of absence, or absent without leave, from hospital, and conditionally discharged patients. ‘Detained patients’ also includes patients subject to holding powers such as sections 4, 5, 135 or 136, and patients recalled to hospital from community treatment order (CTO). These counts may also include notifications about the deaths of people subject to the MHA who are in the community and not in hospital.
Data on notifications may be updated over time and therefore successive extracts may lead to changes in overall numbers unrelated to new cases.
The chart shows the number of deaths by week of death.
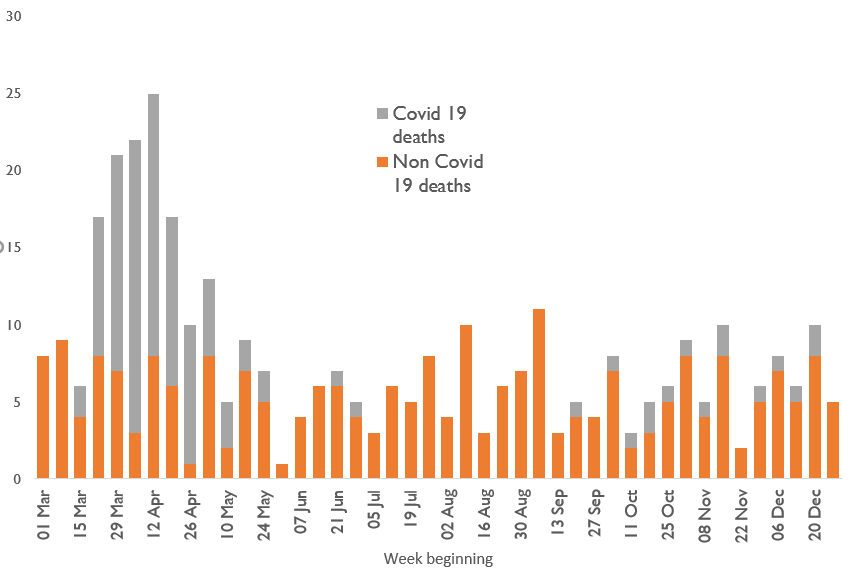
Of the 359 notifications from mental health providers in the 2020 period (covering all causes of death), 279 were from NHS organisations, of which 84 deaths were indicated as being COVID-19-related, and 80 were from independent providers, of which 29 deaths were COVID-19-related.
We have identified 17 detained patients whose deaths have been notified to us from 1 March to 1 January 2021 who had a learning disability and/or were autistic: the majority (10) were not identified as related to confirmed or suspected COVID-19 (an increase of 1 from our report in December). Of these people, most also had a mental health diagnosis. Please note that these patients were identified both from a specific box being ticked on the notification form and a review of diagnoses in the free text of the form.
| Age band | 16-17 | 18-24 | 25-34 | 35-44 | 45-54 | 55-64 | 65-74 | 75-84 | 85+ | Unknown | Total |
|---|---|---|---|---|---|---|---|---|---|---|---|
| Suspected or confirmed COVID-19 | 1 | 1 | 4 | 8 | 17 | 24 | 34 | 20 | 9 | 118 | |
| Not COVID-19 | 1 | 12 | 19 | 22 | 34 | 47 | 43 | 36 | 15 | 38 | 267 |
| Total | 1 | 13 | 20 | 26 | 42 | 64 | 67 | 70 | 35 | 47 | 385 |
| Gender | Female | Male | Unknown or unspecified | Total |
|---|---|---|---|---|
| Suspected or confirmed COVID-19 | 40 | 67 | 11 | 118 |
| Not COVID-19 | 76 | 150 | 41 | 267 |
| Total | 116 | 217 | 52 | 385 |
| Ethnicity | Suspected or confirmed COVID-19 | Not COVID-19 |
|---|---|---|
| Asian | 4 | 6 |
| Black | 12 | 23 |
| Mixed | 3 | 5 |
| Other ethnic groups | 1 | 2 |
| White | 69 | 156 |
| Unknown | 24 | 63 |
| Not stated | 5 | 12 |
| Total | 118 | 267 |
| Place of death | Suspected or confirmed COVID-19 | Not COVID-19 |
|---|---|---|
| Medical ward | 71 | 81 |
| Psychiatric ward | 36 | 85 |
| Hospital grounds | 1 | 6 |
| Patient’s home | 0 | 24 |
| Public place | 0 | 6 |
| Other | 1 | 29 |
| Not stated | 9 | 36 |
| Total | 118 | 267 |
ONS data on all weekly deaths in England (COVID and non-COVID) compared with the average for 2015-2019
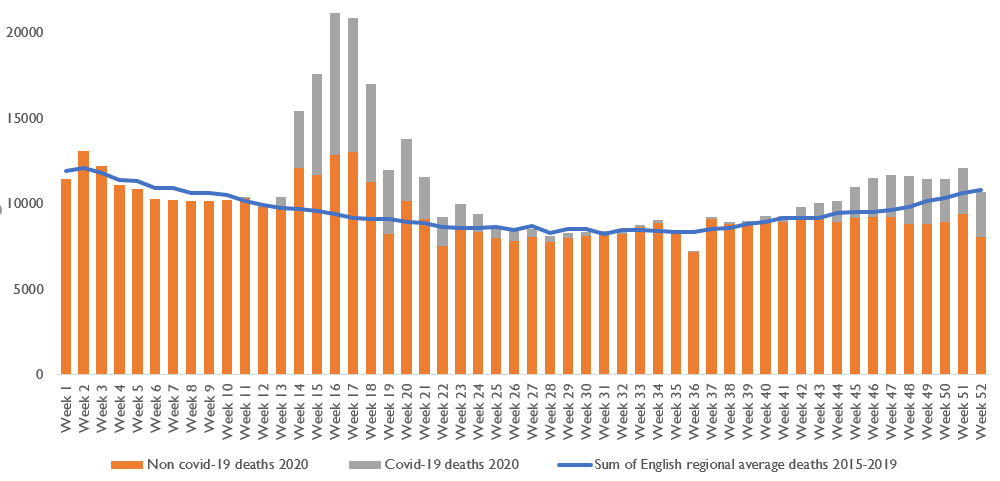
Source: ONS COVID/non-COVID 2020 death data and 2015-2019 death data. Week 52 is the week ending 25 December 2020.